
This report highlights the bottlenecks of a process directly on its BPMN diagram.
The objective is to be able to quickly identify the tasks responsible for bottlenecks.
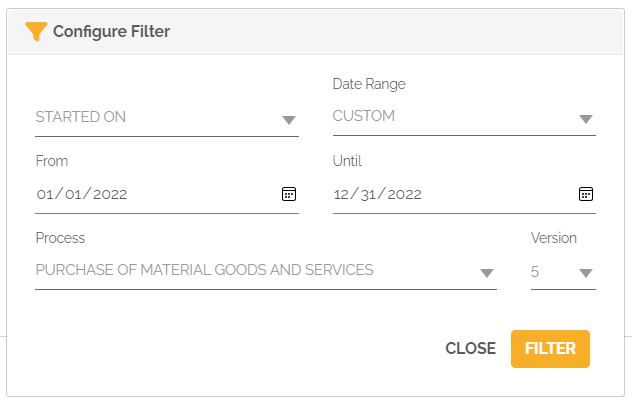
You must select a period, a process and its version. The periodic filter considers work item tasks:
- If you choose the “Started on” option, the selection will then be made on all the tasks that started in the selected period and that correspond to the chosen segmentation.
- If you choose the “Completed on” option, the selection will then be made on all the tasks which have been completed in the selected period and which correspond to the chosen segmentation.
- If you choose the “Started on and still open” option, the selection will then be made on all the open tasks which started in the selected period and which correspond to the chosen segmentation.
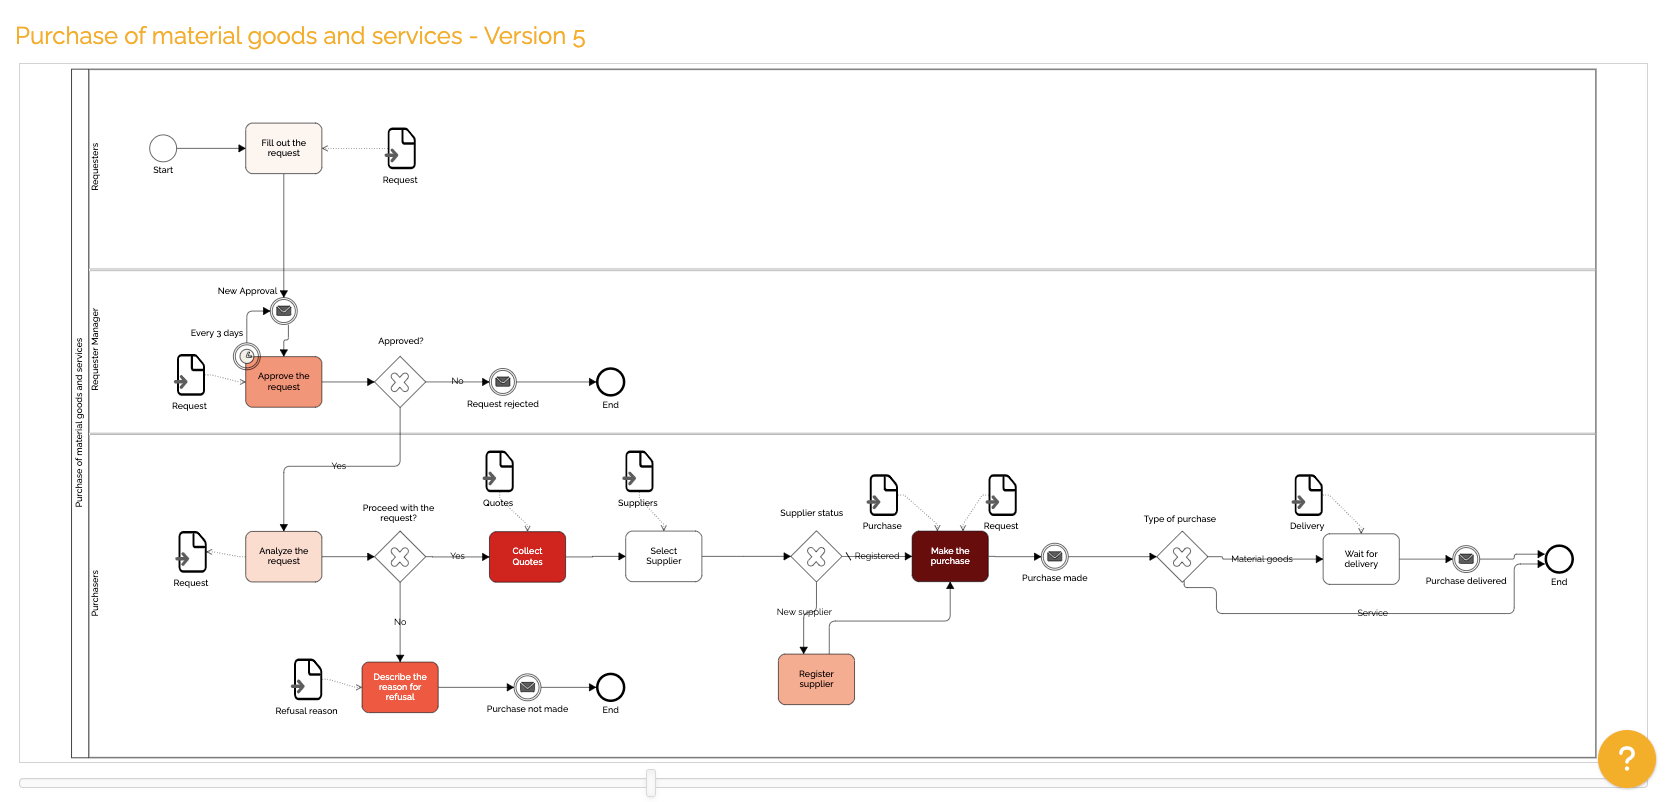
You will then be able to see the process diagram with a color indicator to highlight which tasks are taking the longest to complete. The redder the color of a task, the higher the average working time for that task.
You can have this analysis on all versions of the selected process. You must select this option:
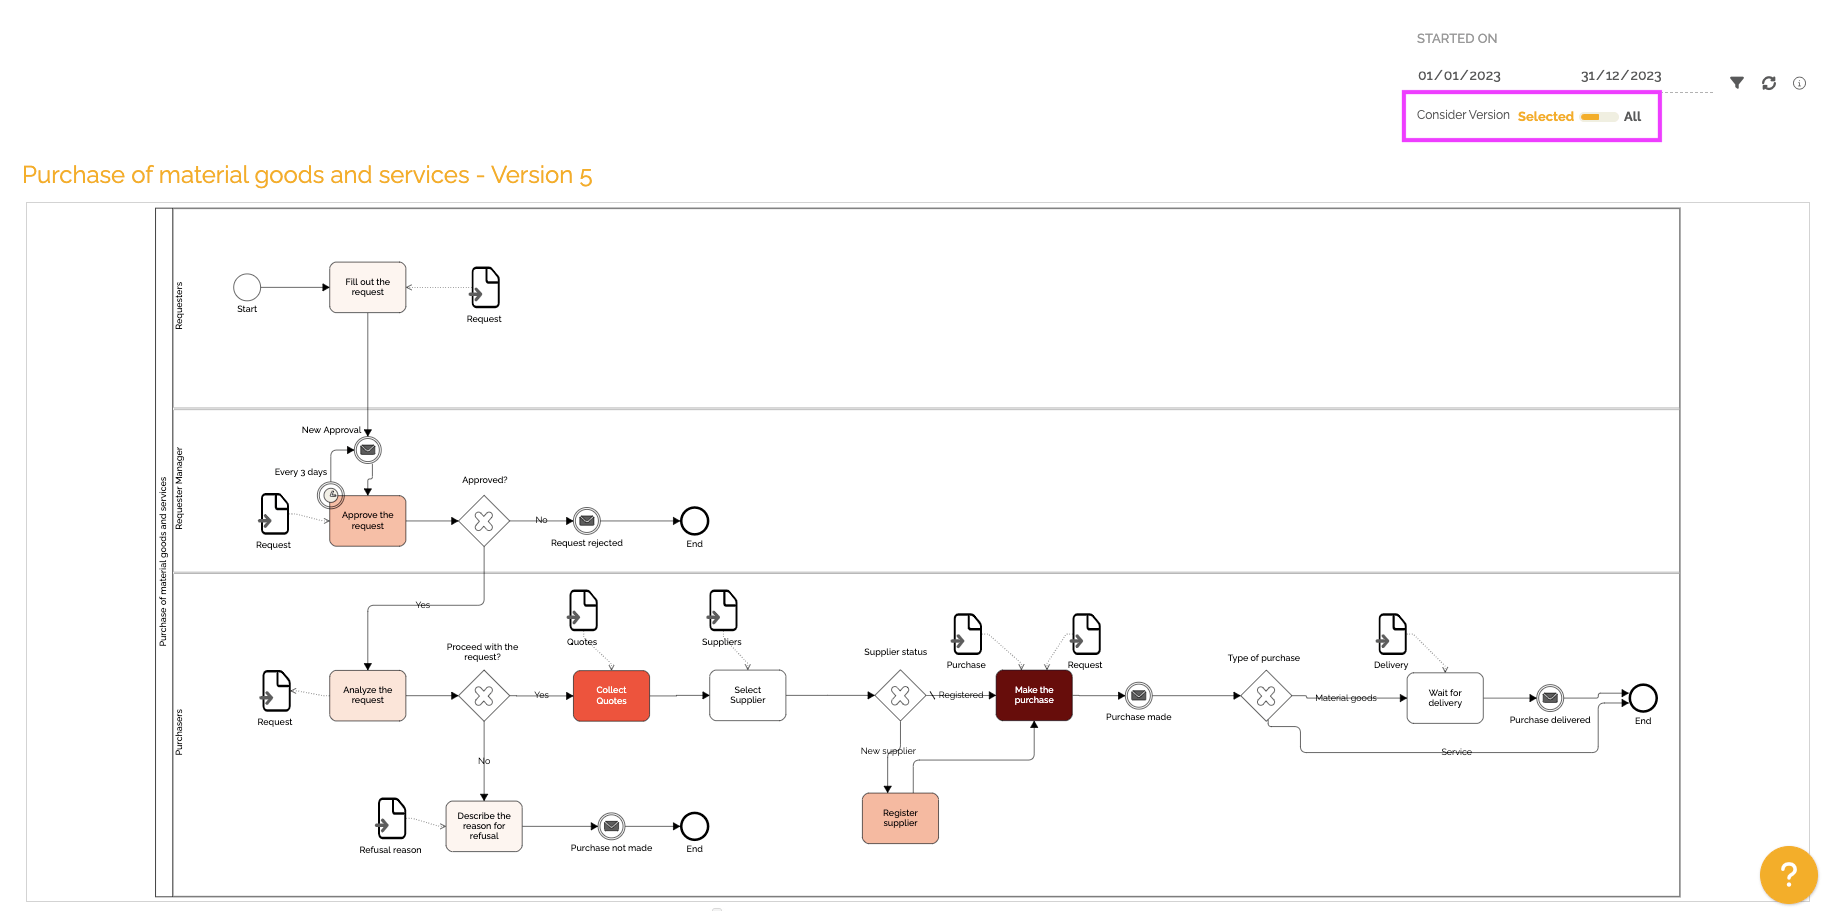
For information : By activating this option, the diagram displayed remains that of the previously selected version. Data processing is only done on tasks common to all versions (same name, same type).