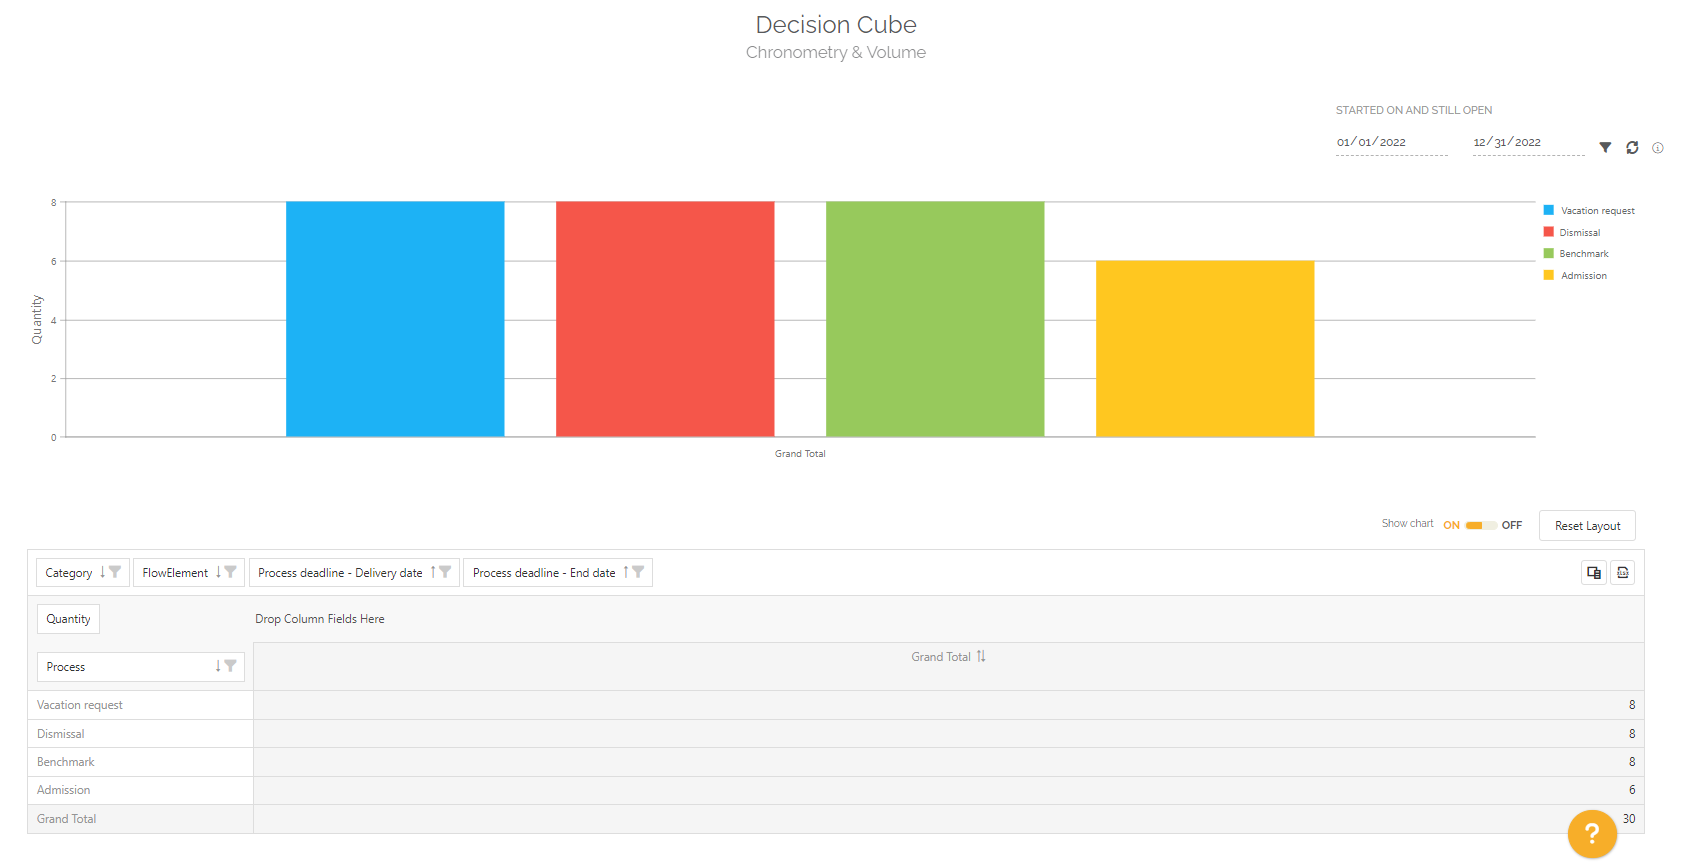
It is a pivot table that you can adapt to analyze the number of tasks executed according to the criteria of your choice.
The objective is to be able to analyze the data from different possible angles to obtain the desired information.
For example: If the database contains 2 work items, item A completed 5 tasks and item B completed 4 tasks, then this decision cube will show 9 as the result, because there were 9 task executions.
There is a graph that adapts according to the defined table.
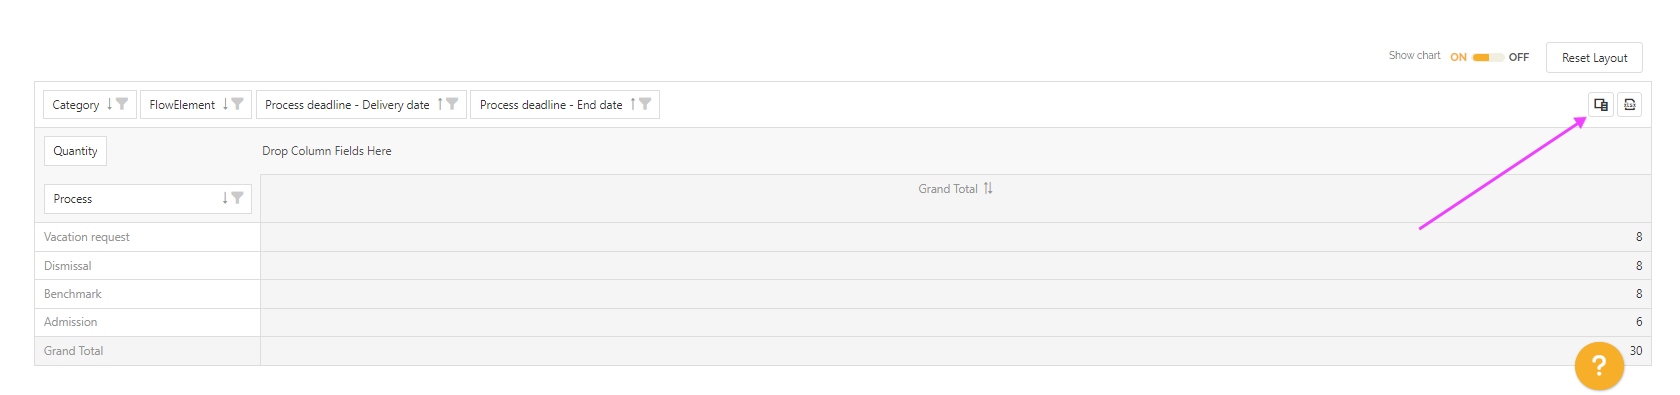
You can add properties by clicking on this icon:
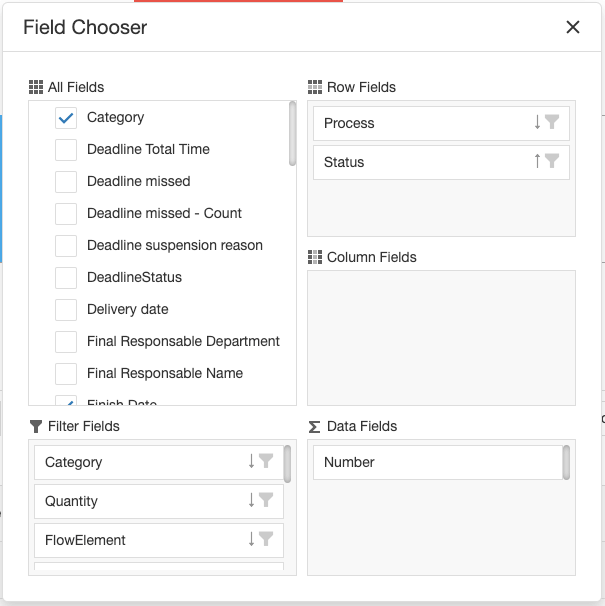
You can then add the desired properties to display an additional level of detail to your table.
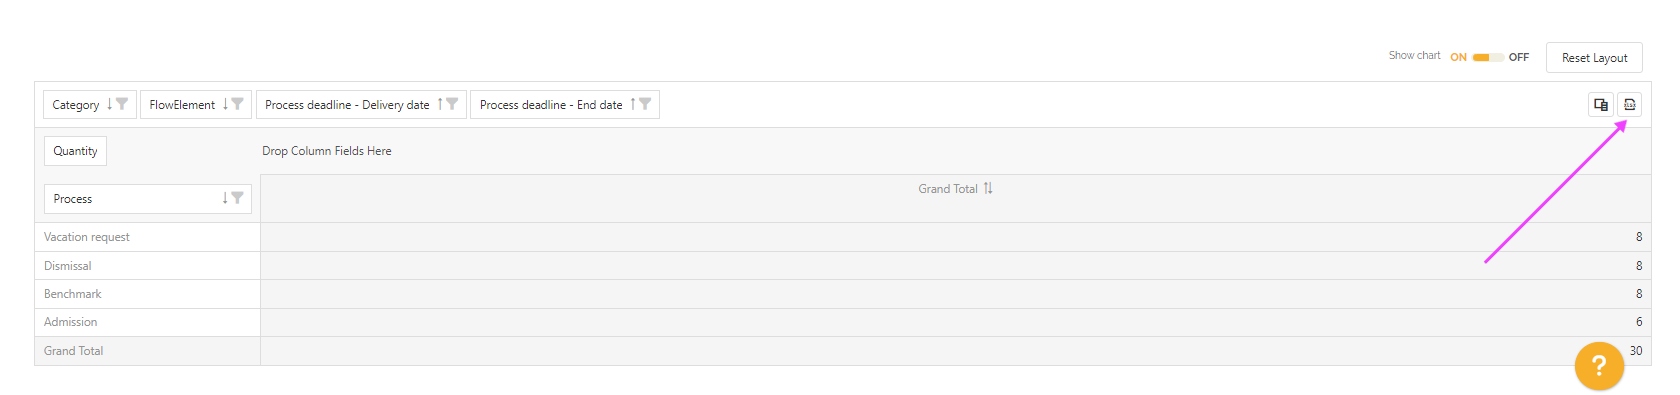
You can download this table in excel format by clicking on this icon: