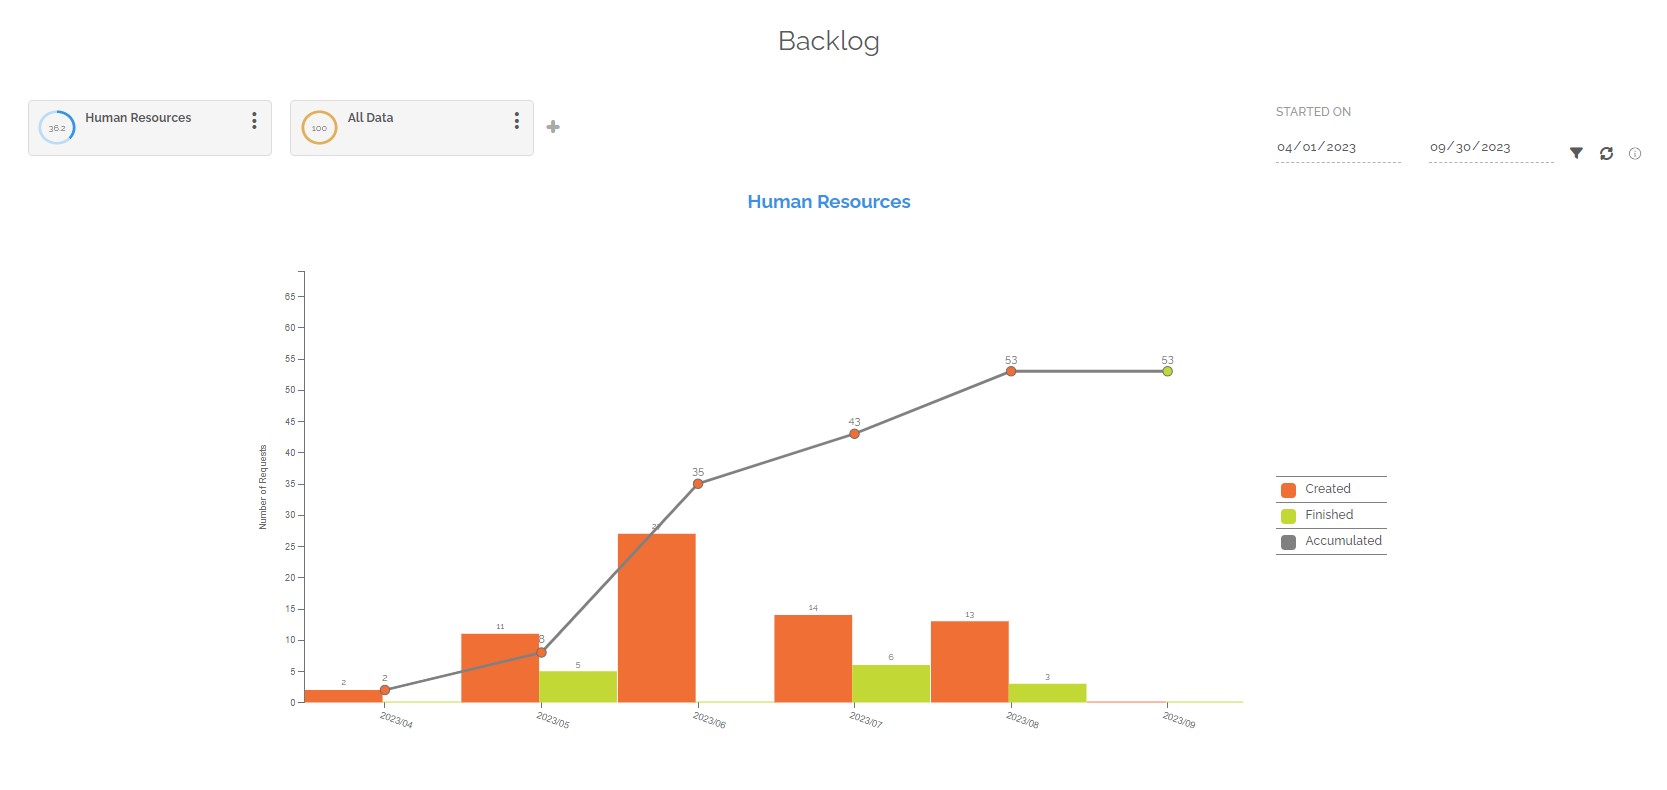
This report highlights the number of work items created in red and those that were completed in green. There is also a curve showing the evolution of the number of open work items over the selected period.
The goal is to analyze the ratio of open and closed work items in a given time period. This makes it possible to know the existing work intensity and its evolution on a selection of processes or for a specific team.
This report creates a chart for each selected segmentation. Segmentation is important in this report because it only highlights quantities over a time period. It is therefore important to configure the segmentation on the targeted processes and/or the teams concerned in order to be able to analyze the desired data.
The periodic filter considers all work items:
- If you choose the “Started on” option, the selection will then be made on all work items that started in the selected period and that correspond to the chosen segmentation.
- If you choose the “Finished on” option, the selection will then be made on all work items which were finalized in the selected period and which correspond to the chosen segmentation.
- If you choose the “Started on and still open” option, the selection will then be made on all the open work items that started in the selected period and that correspond to the chosen segmentation.
This data is displayed on a time axis that depends on the selected period:
- 15 days or less, the chart displays a day-by-day x-axis.
- Over 15 days to 90 days inclusive, the axis shows weekly data.
- Over 90 days to 730 days inclusive, the axis displays monthly data.
- Over 730 days, the axis shows annual data.
For information : The evolution curve point color of the number of open work items depends on the accumulation, if it increases, it indicates an increase in work intensity, so the color is red, if it stays or decreases, the work intensity stabilizes or decreases, the point is then green.
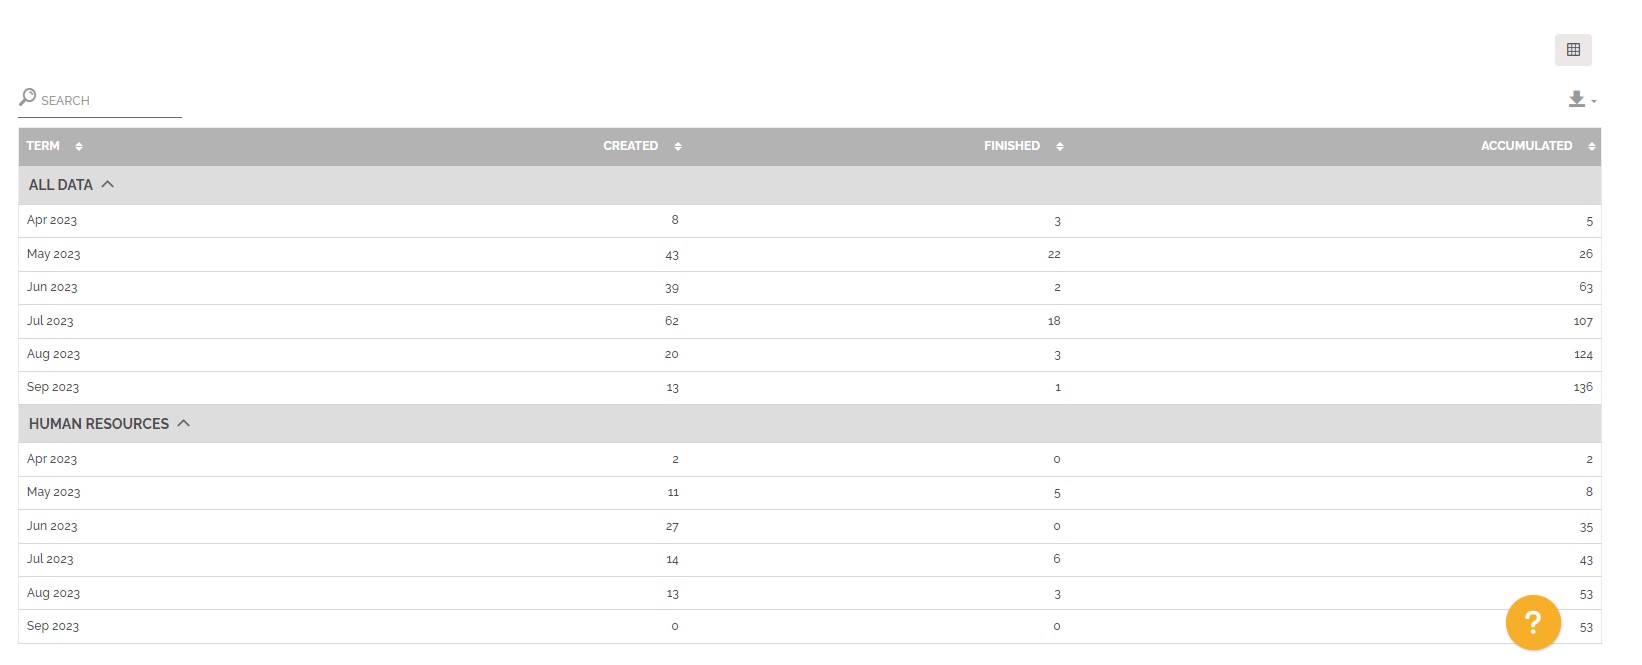
Below the graph you will find a table divided into several parts. Each part represents a segmentation with the following information:
- The distribution of the period studied, as seen previously, depends on the number of days selected.
- The number of work items created in the time period under review.
- The number of work items completed in the reporting period.
- The number of accumulated work items is the number of work items still open during this period.