
The automation and execution of your processes allow the generation of a database of your different work items. HEFLO gives you the possibility to use this information through dashboards to help you in your daily decision-making. To learn more about management dashboards: Tutorial: How to create a management dashboard.
The system also allows you to export this database to be able to integrate it into your Business Intelligence tools. To learn more about data export: Tutorial : Data Export.
In addition to this, we provide you with ready-to-use analytical reports that meet different objectives so that you can analyze analyze this data.
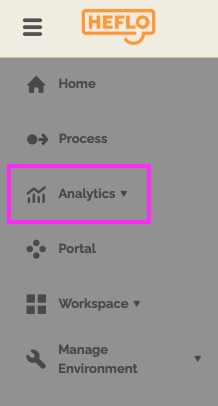
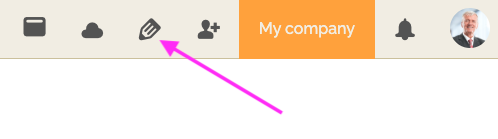
You can access the various reports in the menu on the left by clicking on “Analytics”.
Analytical reports are accessible by “administrator” type users or users with a role created giving access to this feature. For more information about roles : Roles on HEFLO.
The different reports are listed in 3 categories:
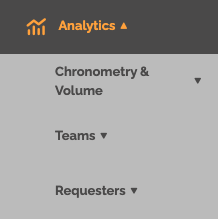
- Chronometry & volume: The goal is to analyze the execution time of the different work items. These reports also make it possible to analyze the execution time of each task and in particular to identify bottlenecks.
- Teams: The objective is to study the performance of the teams and users responsible for the various work elements concerned. These reports will allow you to see if your teams are reaching the objectives set in terms of quantity and deadlines, if these need to be increased, or if the distribution of tasks should be reviewed.
- Requesters: You can analyze the quantity of work items per requester. This will allow you to better understand the intensity of your source of work and to adapt your processes or your teams accordingly.
Provide access to analytical reports
Users with an administrator role have access to all analytical reports and can perform all possible actions.
To provide access to analytical reports for a role:
- Go to the “Users and Authorization” page and the “Roles” tab.
- Create or edit the desired role.
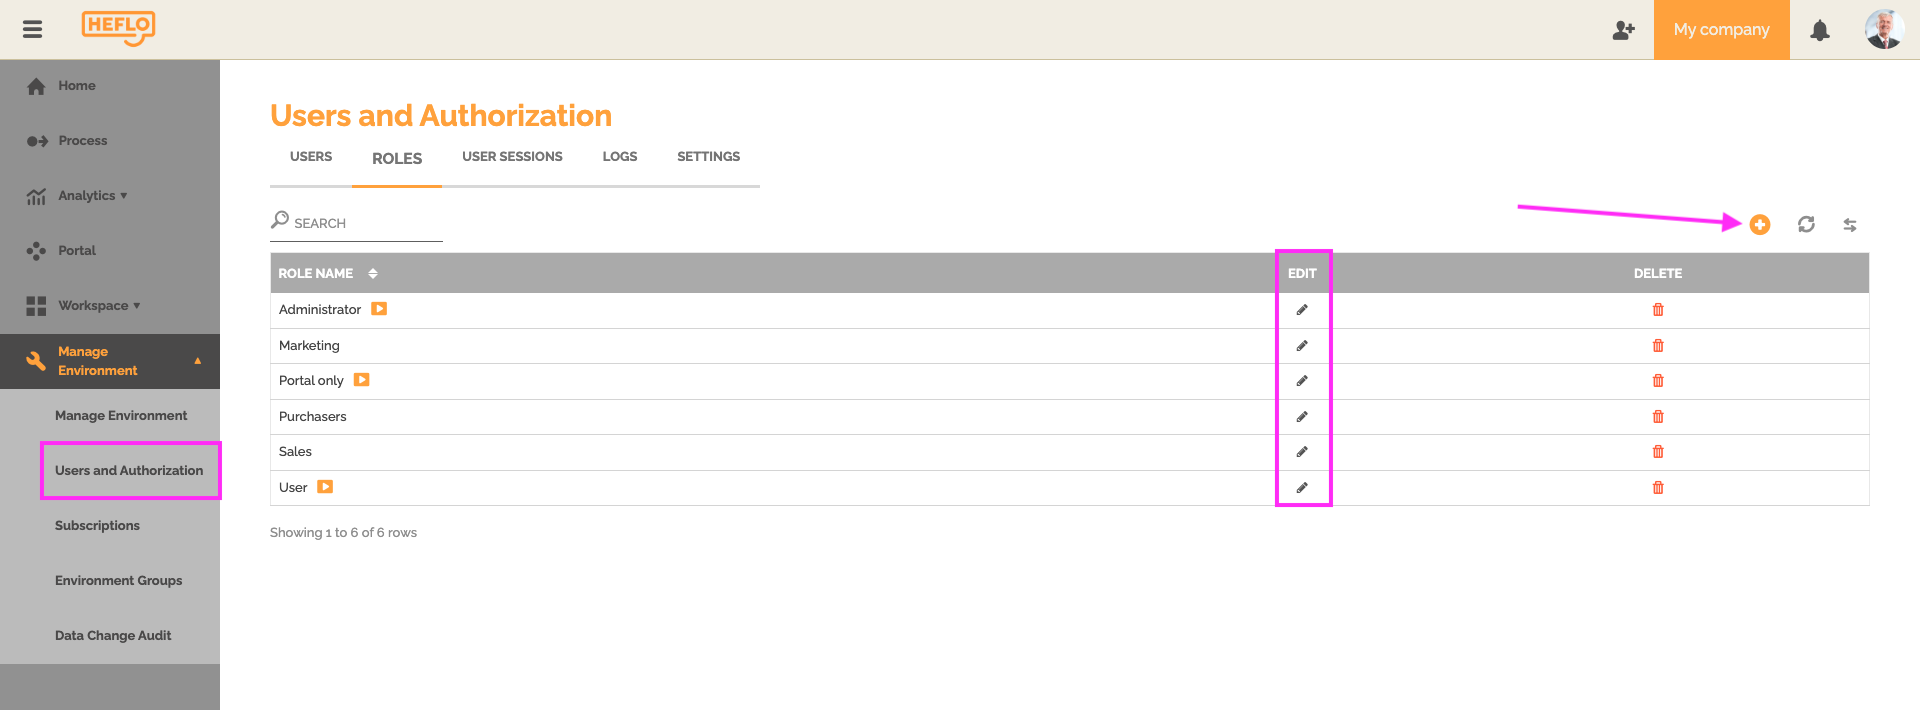
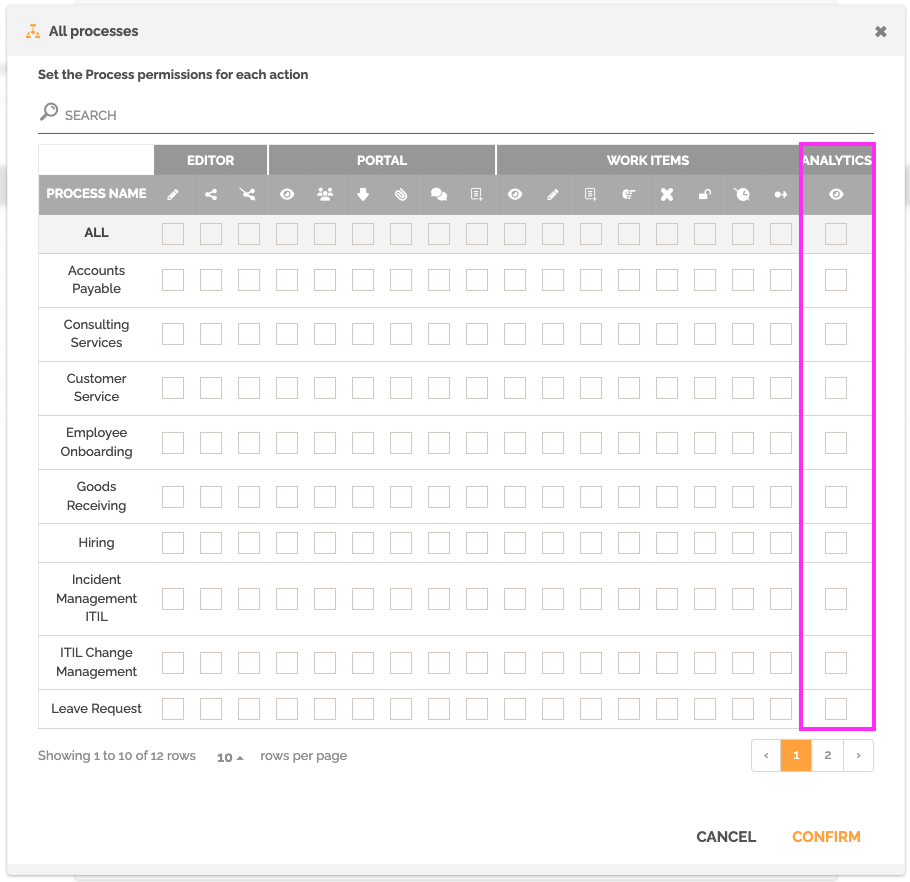
- Click “Select Processes”.
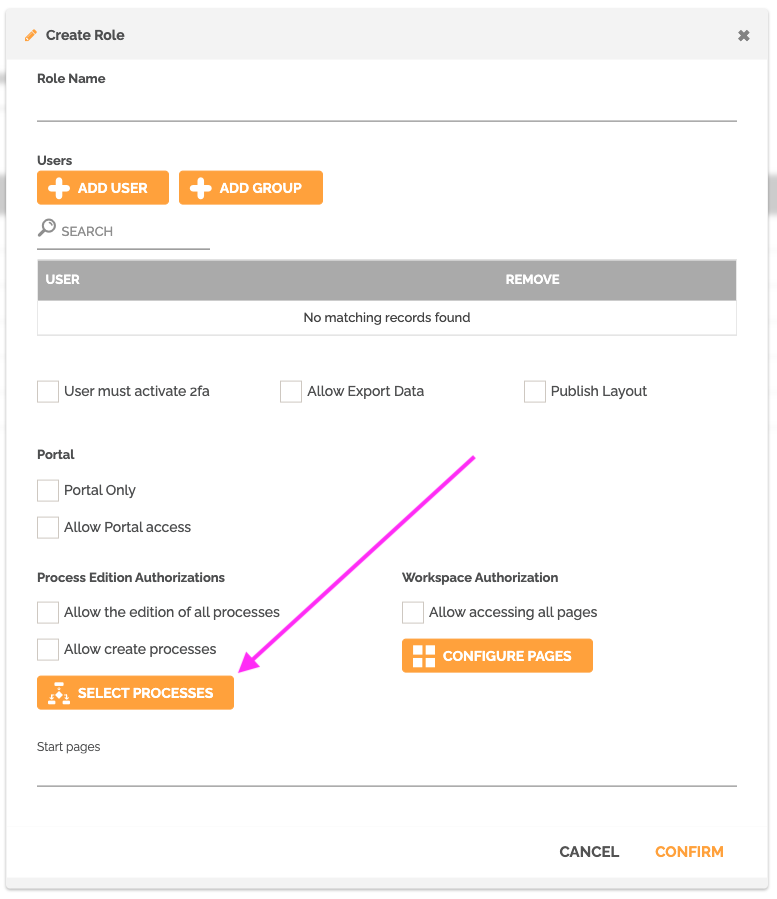
- Activate the “Analytics” option for all processes or a selection.
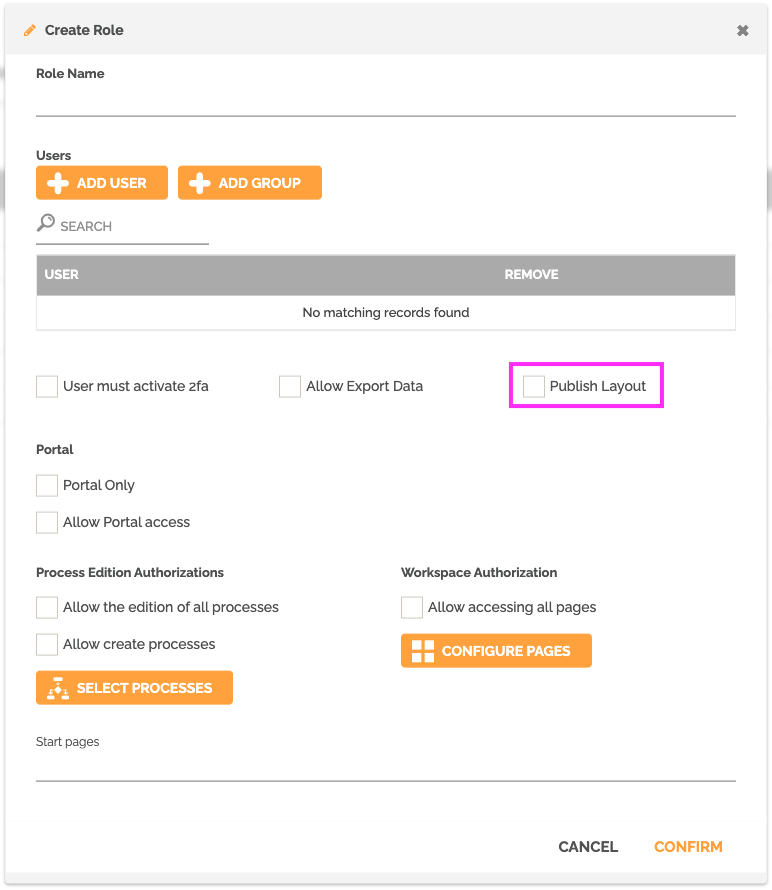
- Go back to the role settings screen and select the “Publish layout” option if you want the user to be able to share segmentations or layouts. We will see these two concepts later in this article.
The elements that make up an analytical report
There are several reports in these different categories.
The majority of reports are composed as follows:
Choice of segmentation
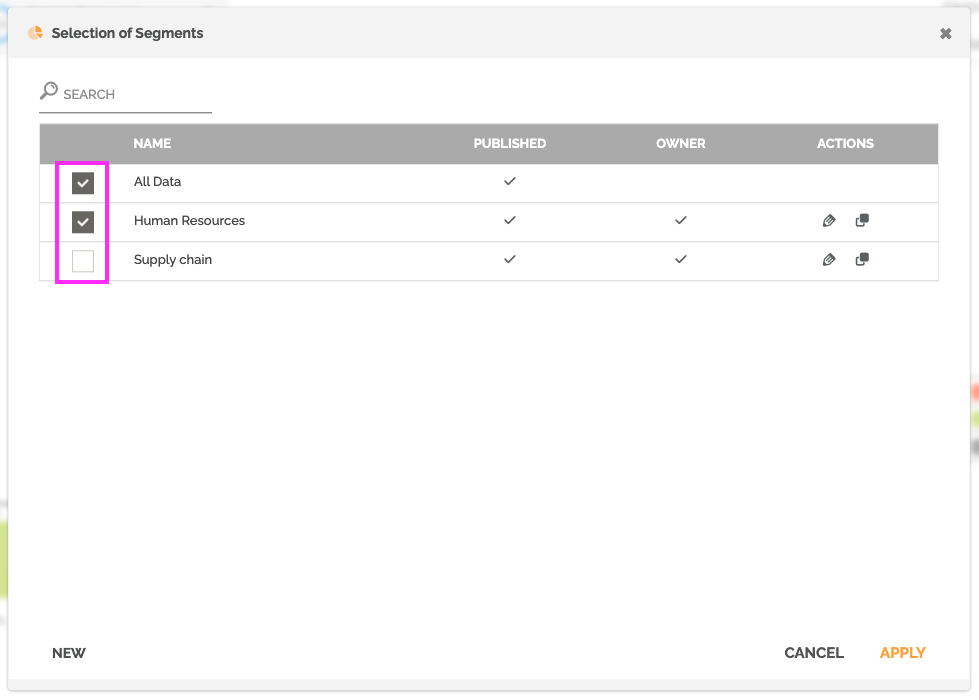
You can create, select or even deselect one or more segmentations.
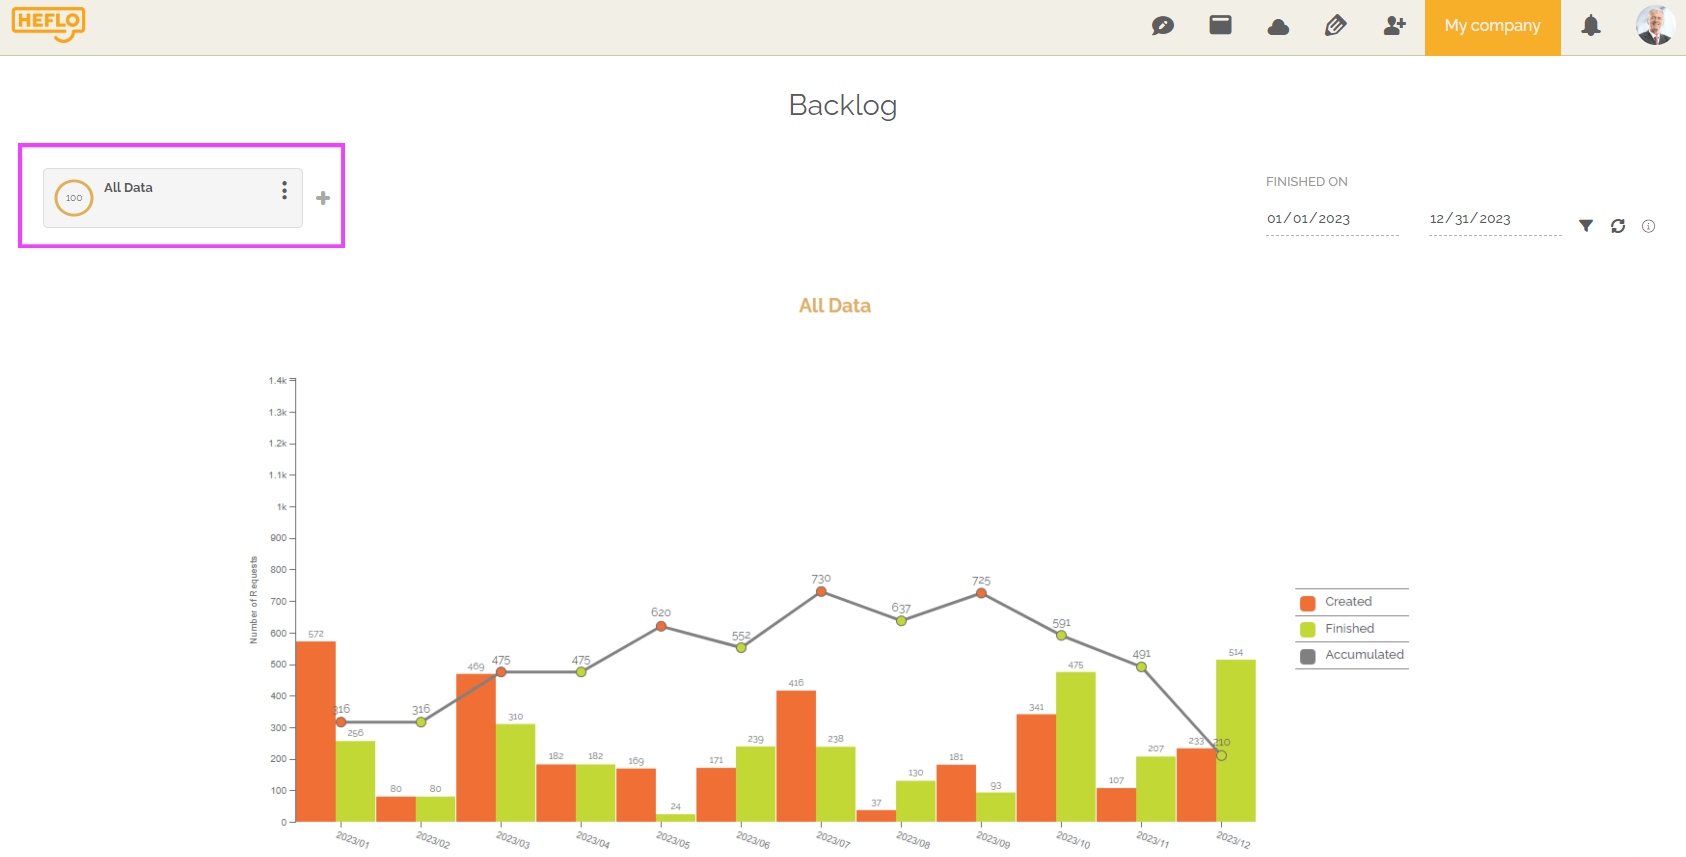
The goal is to determine a selection of work items highlighted in the relevant report. By default, the report highlights all work items in your environment.
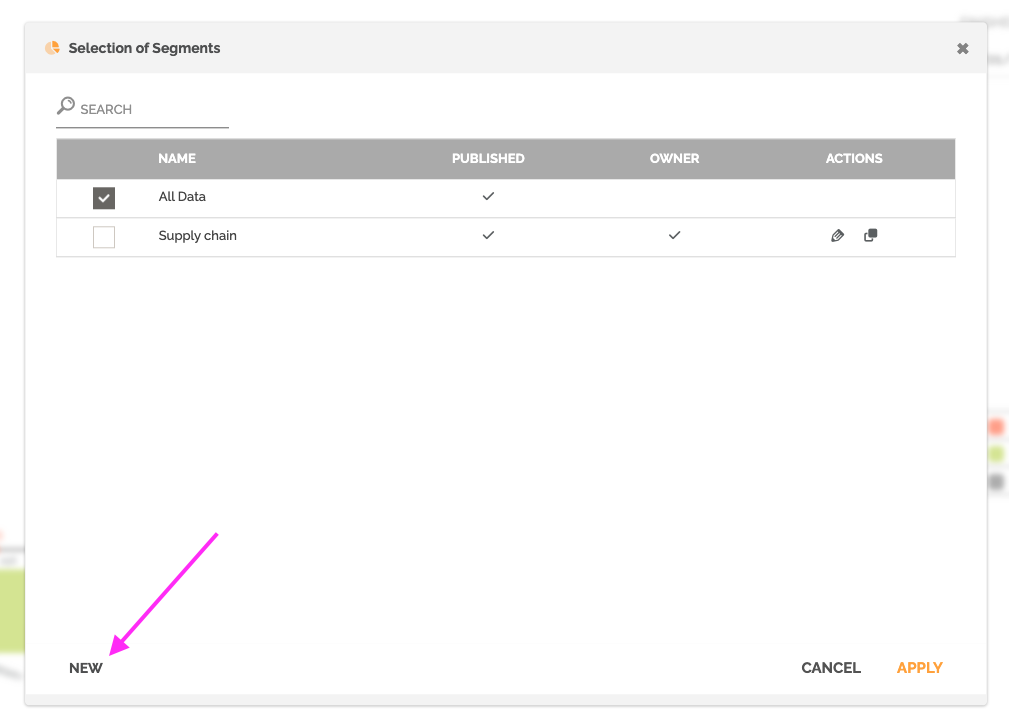
It is possible to create a segmentation by clicking on the “+”.

You will then find all the existing segmentations in your environment. You then have the possibility to select several different segmentations. The graphs and tables will then adapt to the number of segmentations selected.
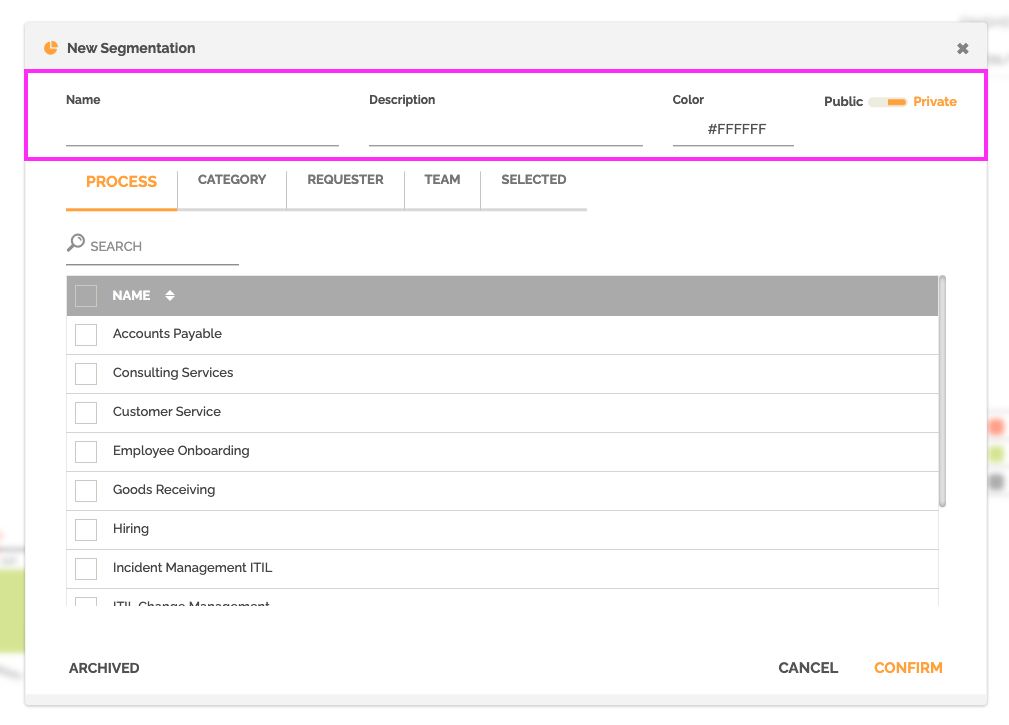
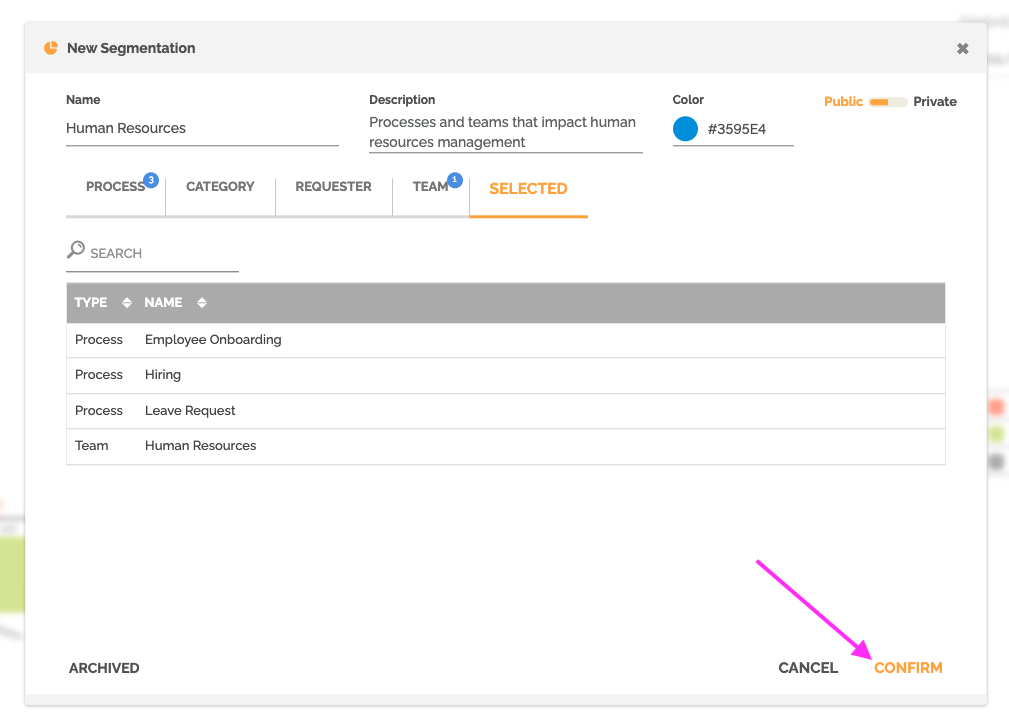
To create a new segmentation, click on “New” at the bottom left:
From there, you need to choose a name, describe the purpose of this segmentation, associate a color to it, and decide if it will be available to other users who have access to analytical reports in your environment. If you want to make this segmentation available to other relevant users, then select the “public” option. By default, the option that is selected is “private”.
For information: You can make a segmentation public only if your user role has the “Publish layout” option activated. Users with an administrator role have this option enabled.
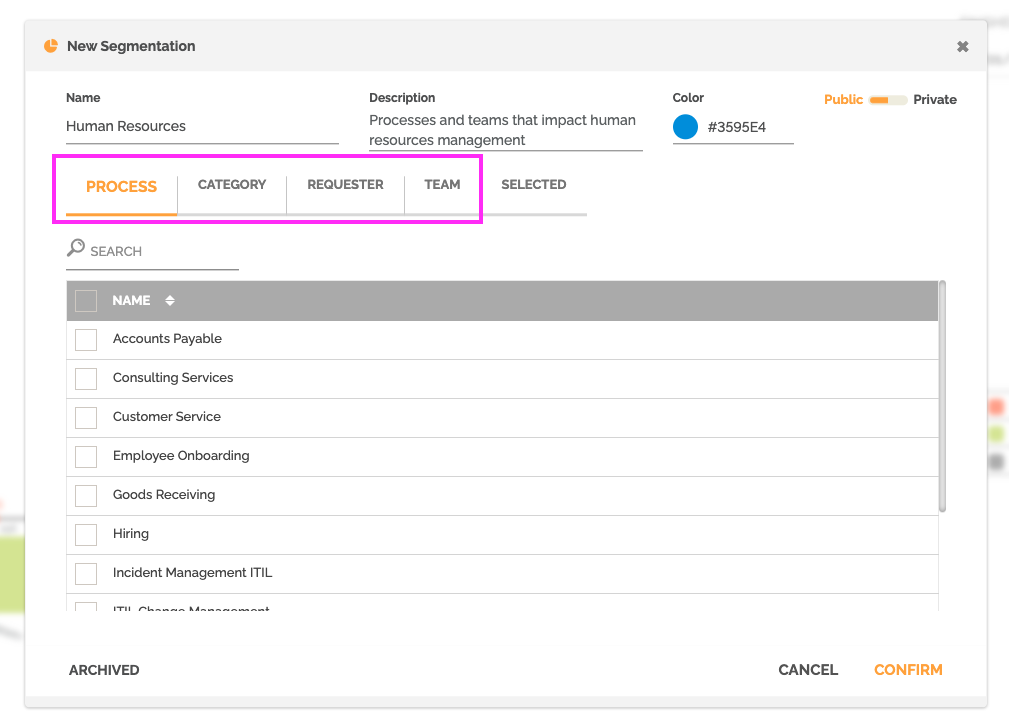
The second step consists in choosing the “filters” which will make it possible to select the various work items. You can select a list of processes, a list of process categories, participants who are currently responsible for work items, or a list of requesters.
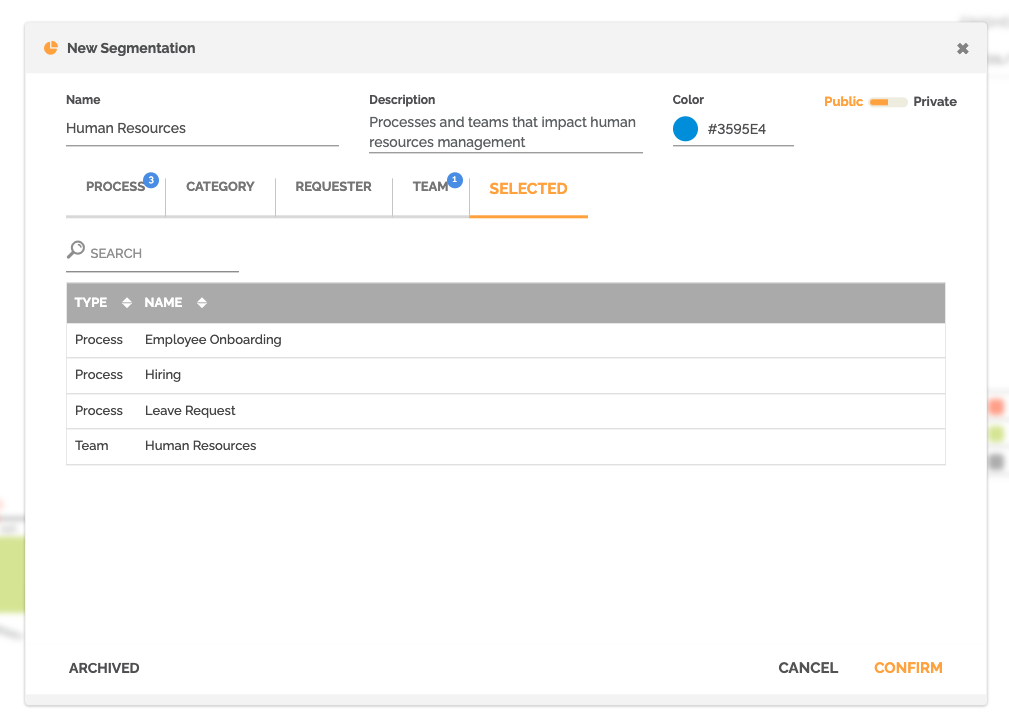
You will find the configuration of your selection in the “selected” tab.
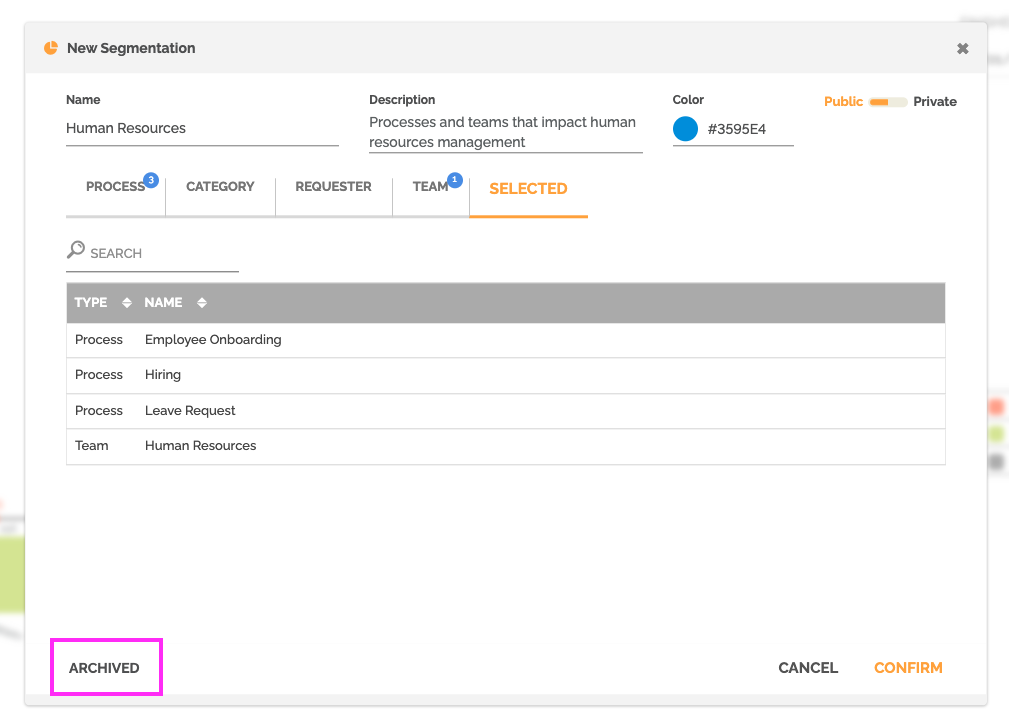
You have the possibility to archive an existing segmentation by clicking on “archived”.
You must click “confirm” to create this segmentation.
The created segmentation will be automatically added to the report.
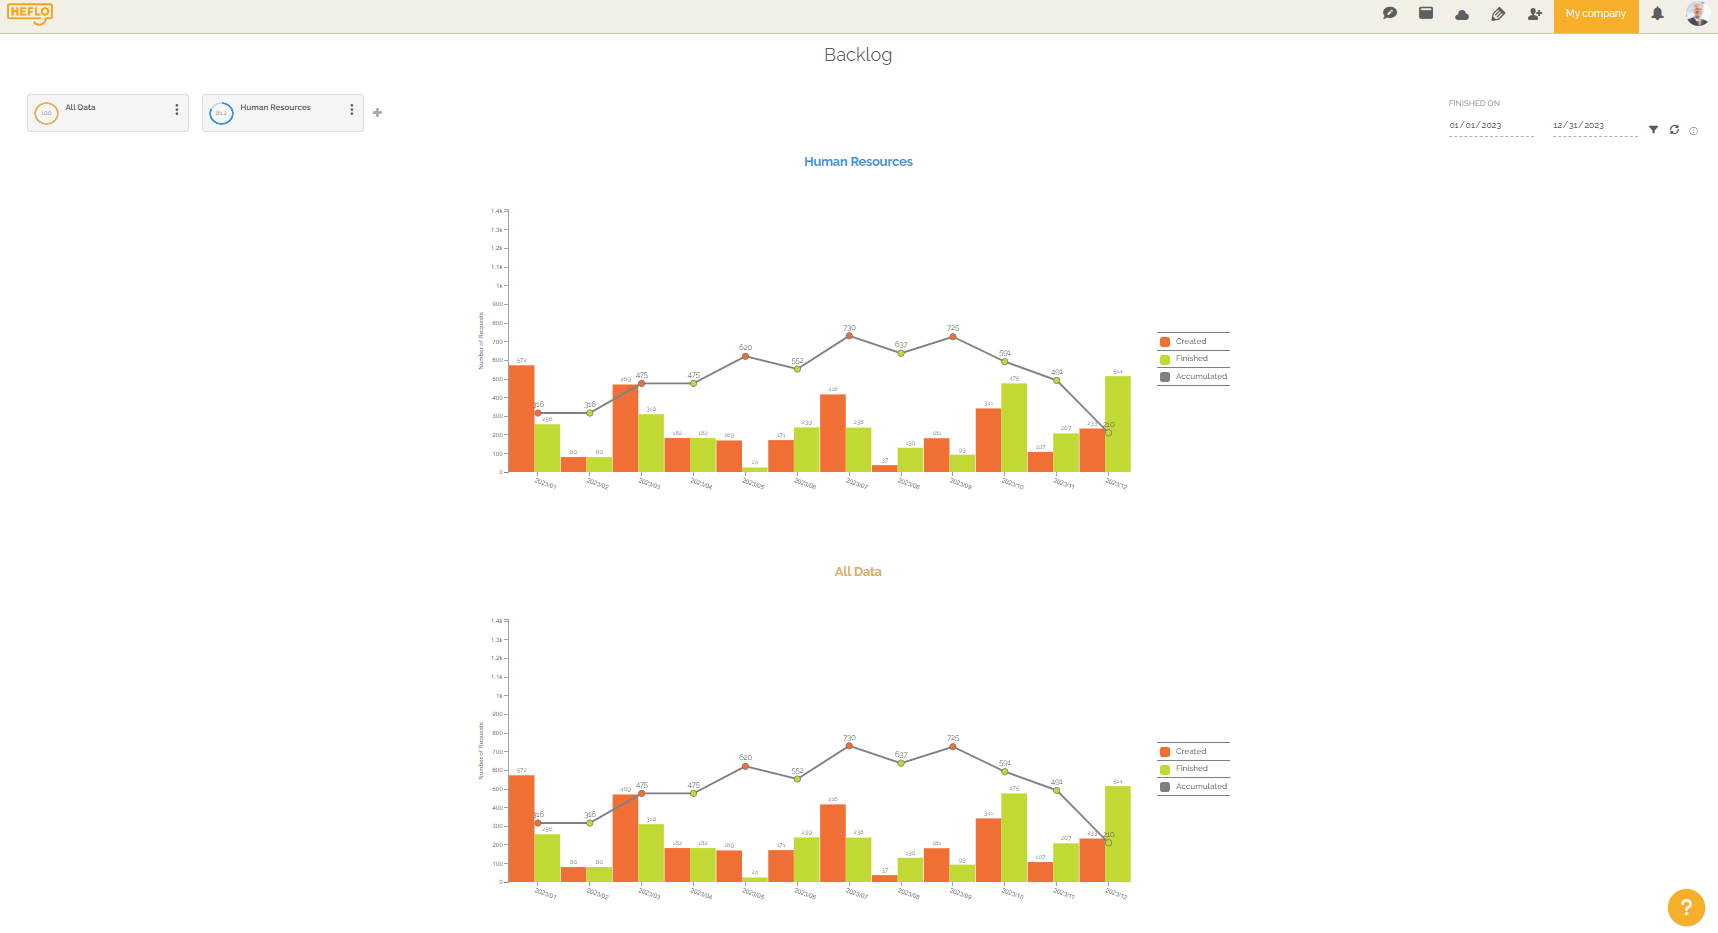
The number of charts and the data table adapt to the amount of segmentations.
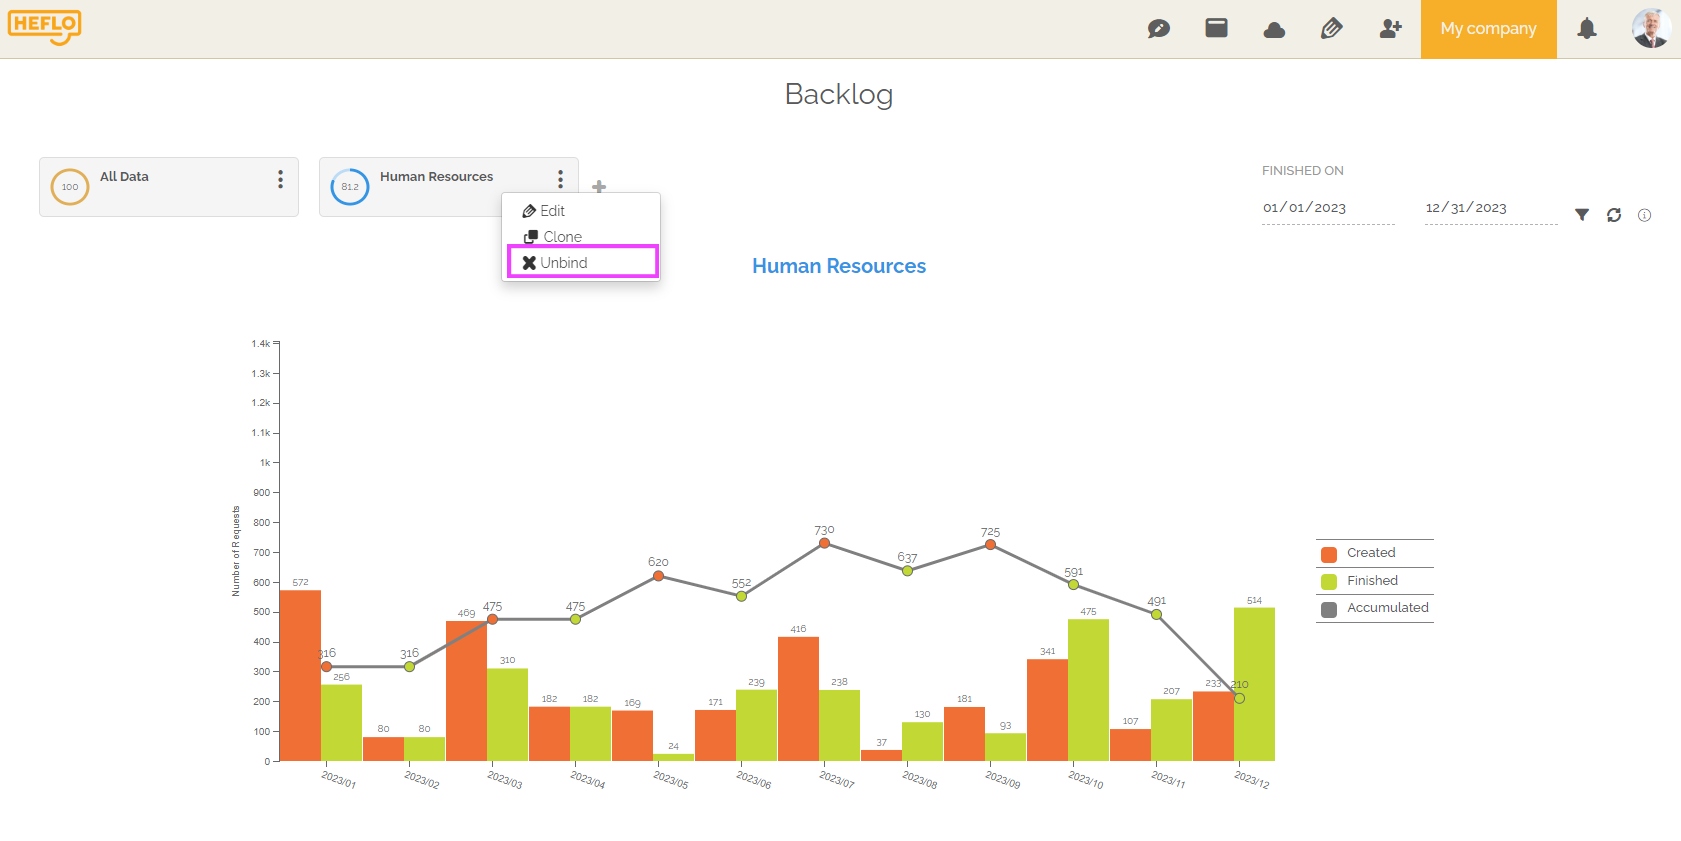
There are two methods to remove a segmentation:
- Click on the icon:
 of the segmentation and click on “Unbind”.
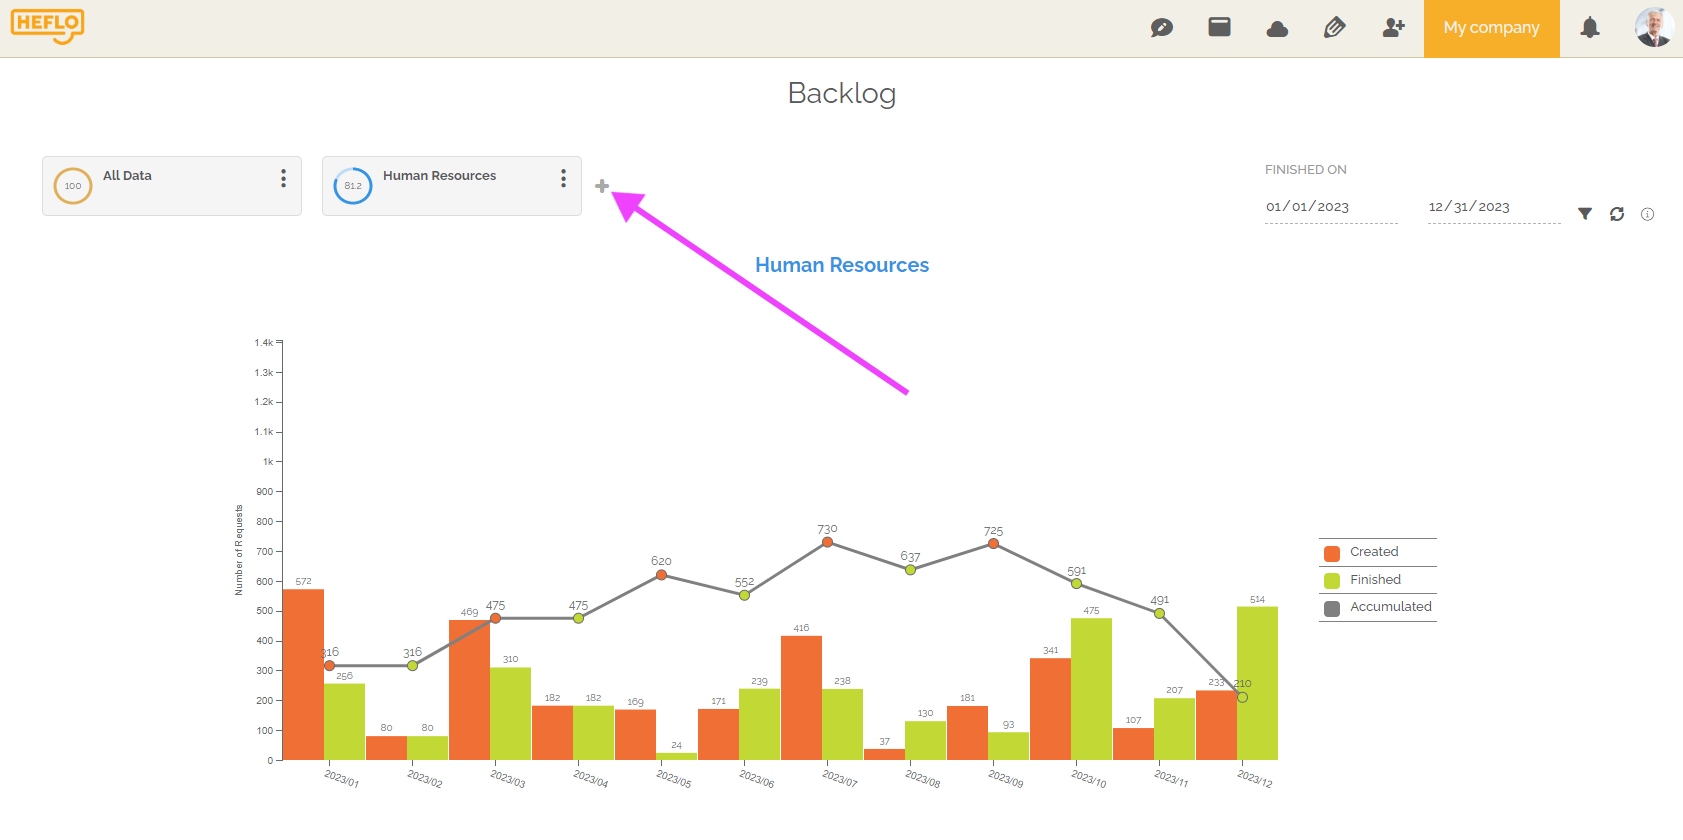
- Click on the “+” and uncheck the segmentation concerned, then click on “apply”.
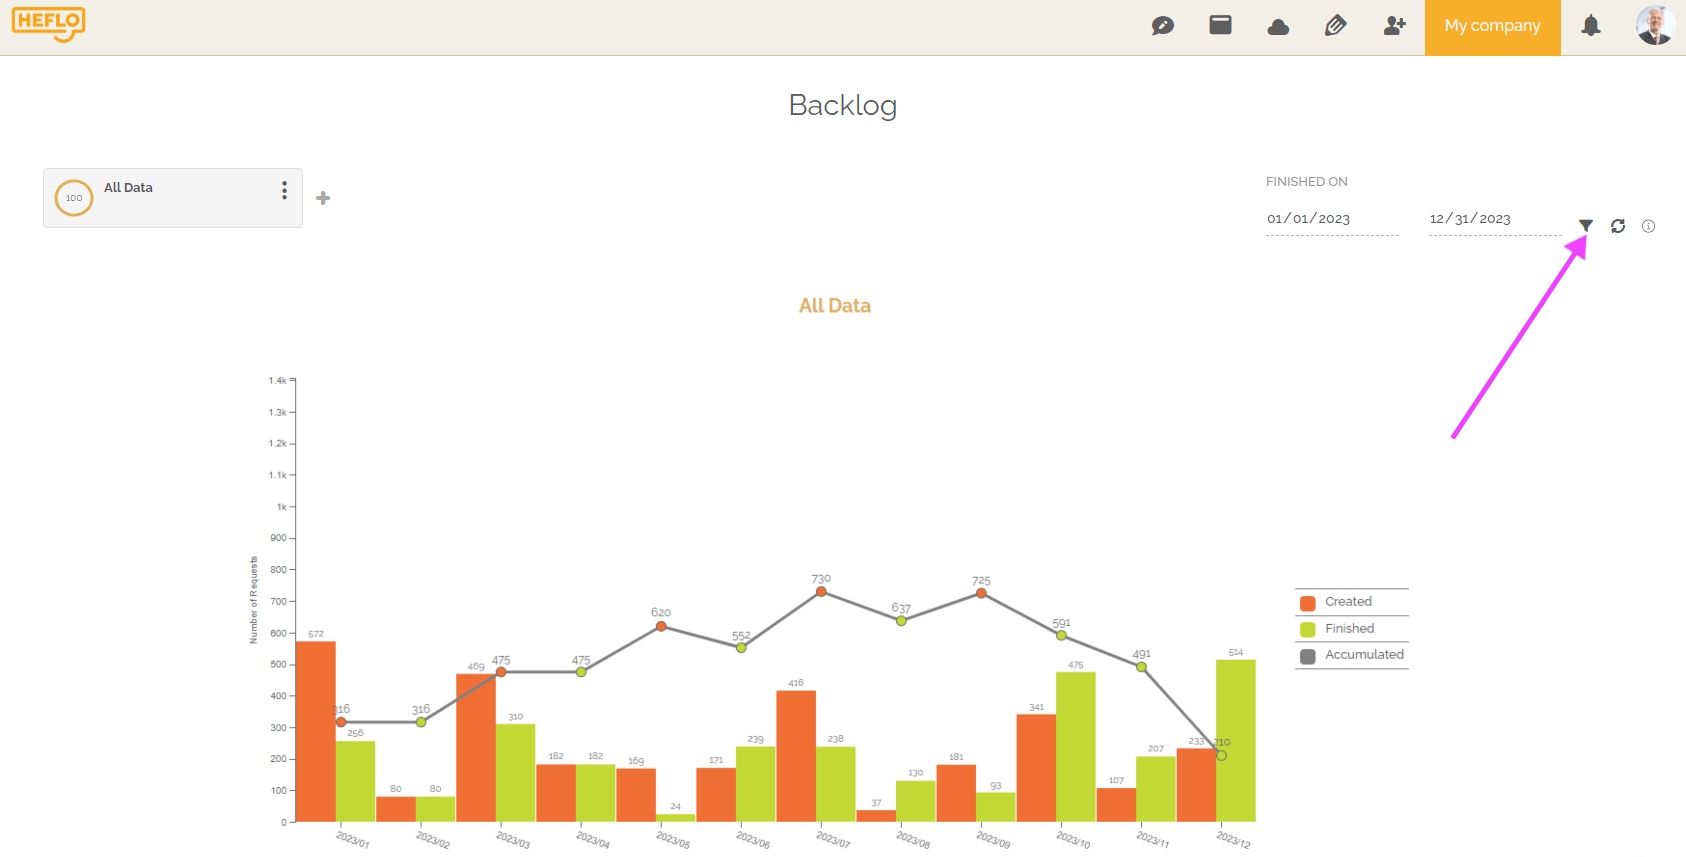
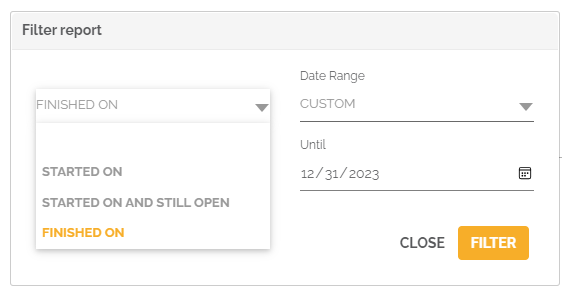
Selection of the period studied
You can select a period for your report.
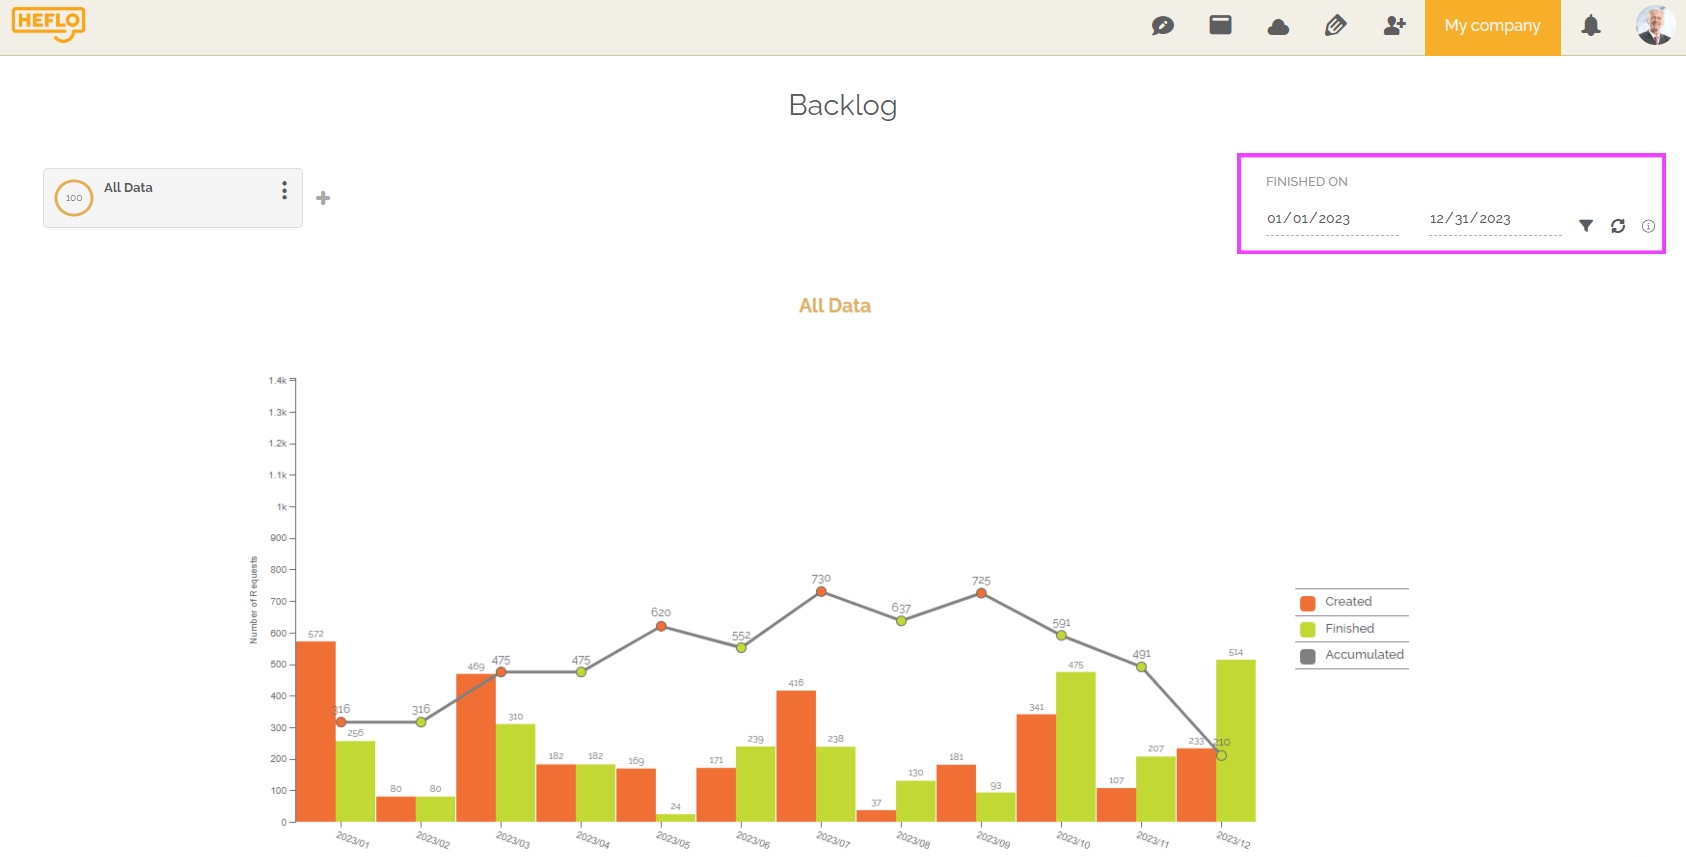
You must click on the filter icon to determine this.
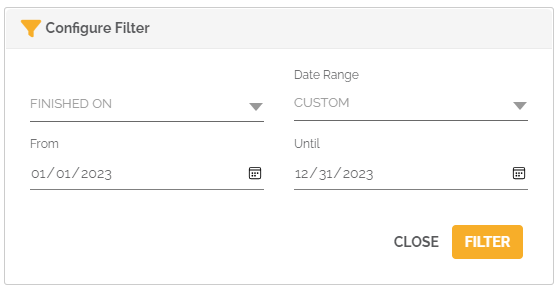
Several options are available. You can choose a custom period or choose a system-determined one.
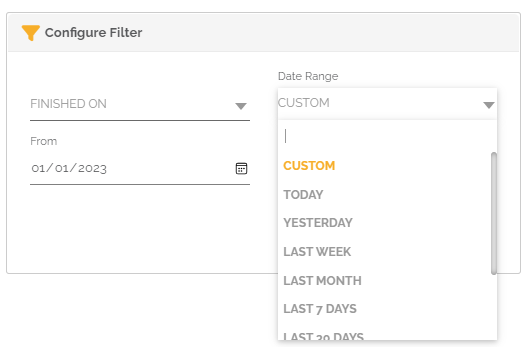
You can choose to determine this period based on the start or end date of the elements studied.
For information: the level studied depends on each report. You can find more information in the documentation of each analytical report.
On some reports you also have the possibility to compare the selected period with another by choosing this option:
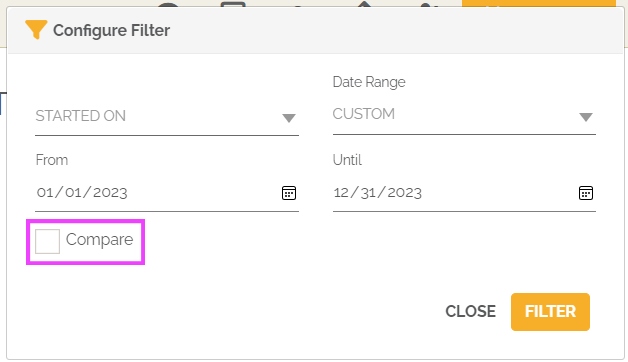
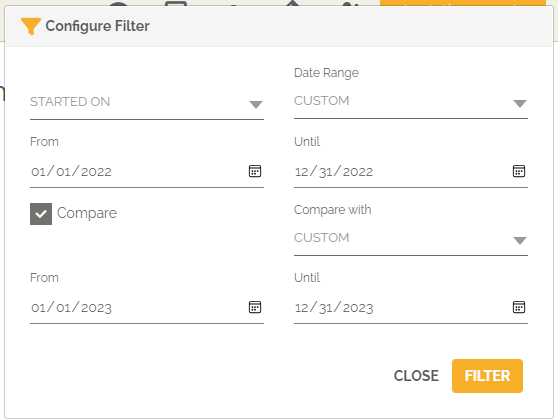
The graph and the data table will adapt to highlight this data comparison for the 2 selected periods.
Layout
You can save a report layout. This corresponds to the segmentations studied. The objective is to avoid redoing this configuration each time.
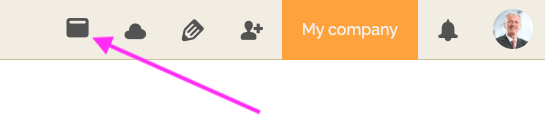
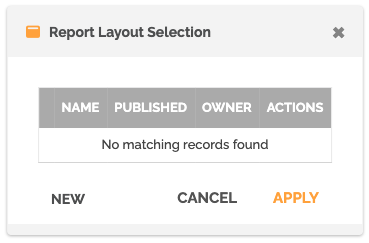
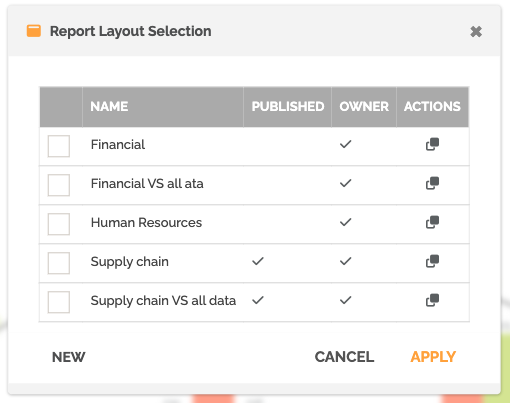
You can click this icon to see the list of existing layouts in your environment.
If the dialog box that appears is empty, it means that no layouts have been saved yet.
Otherwise you will have the list of the different existing layouts:
To create a layout click on “New”.
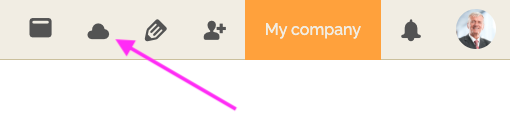
From then on, the page refreshes with the default settings. You can make the changes you want. You must then click on the cloud-shaped icon to save this layout:
You will then have to give a name to this layout, and choose whether it is public and therefore available to other users who have access to the reports, or private and therefore only accessible by yourself.
For information: You have the possibility to make a layout public only if your user role has the “Publish layout” option activated. Users with an administrator role have this option enabled.
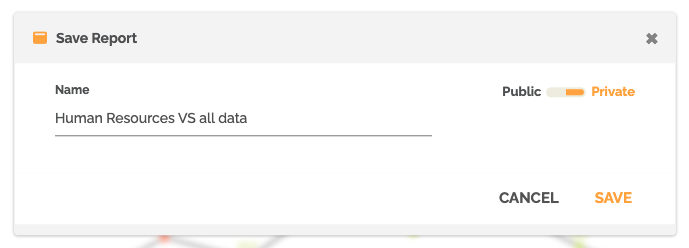
Click “Save”. You can continue to make changes to this layout and click the cloud icon to save this one.
You can also edit the information of this layout by clicking on the pencil icon:
You can then change its name or its publication status. You can also archive it or create a new layout from it. This will allow you to make changes to this new layout without changing the original one.
Chart adapted to segmentation and time period
Depending on the different reports, a graph will be generated to highlight a specific indicator. This will be adapted according to the selected segmentation(s) and the period studied.
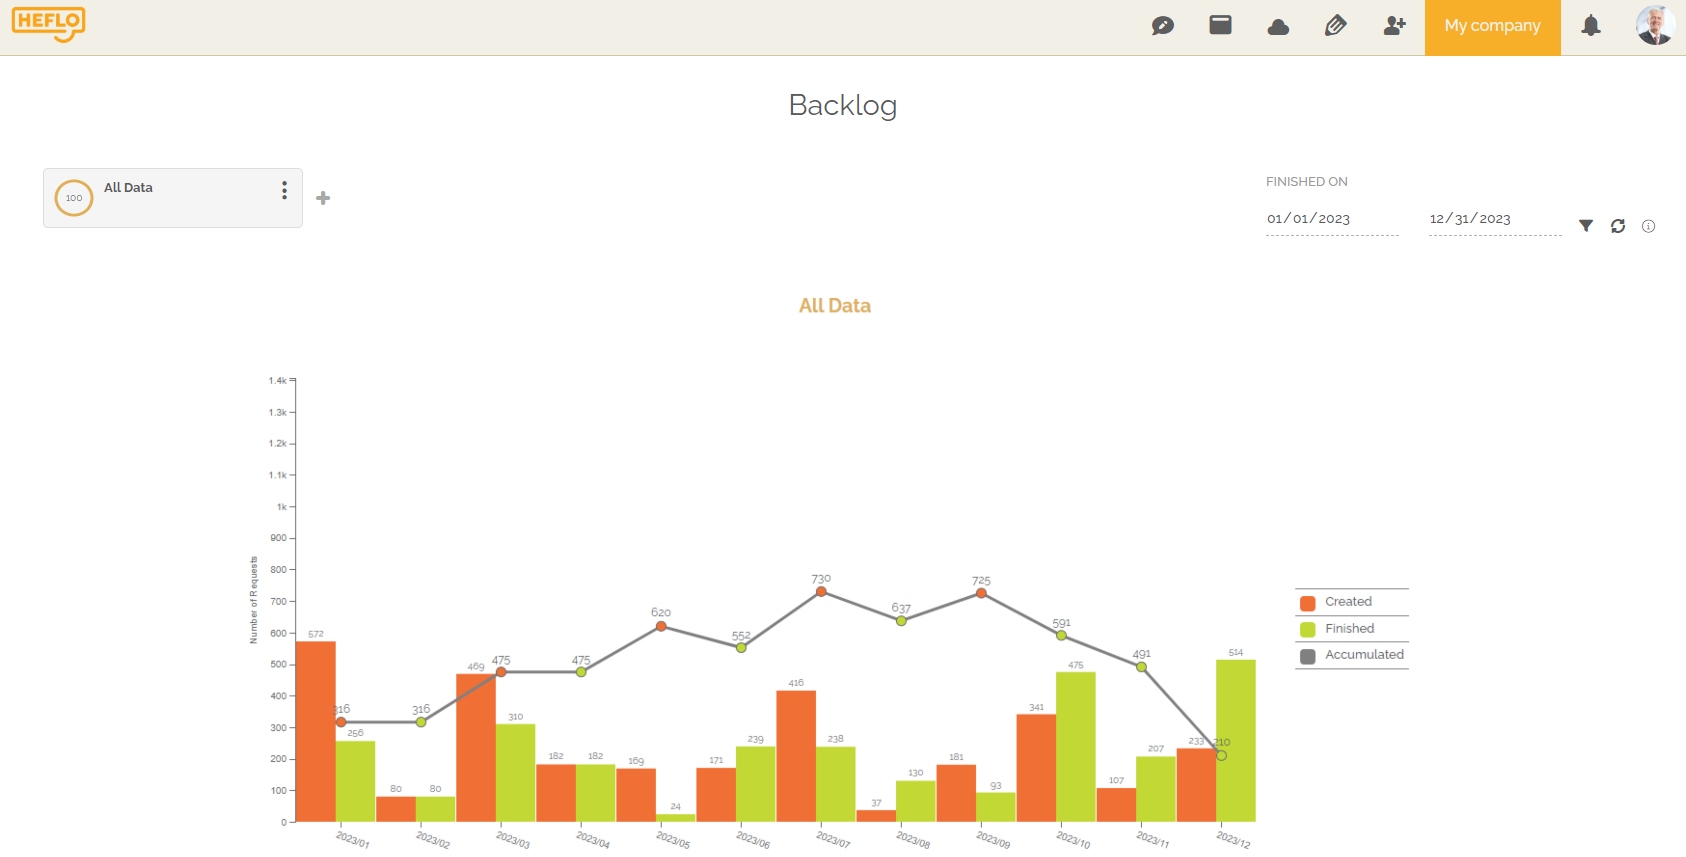
As indicated previously, the graphs adapt to the number of segmentations selected.
In addition, the tables also adapt to the number of segmentations selected.
Data table
Each graph is accompanied by a data table which highlights these according to the segmentations and the periods selected.
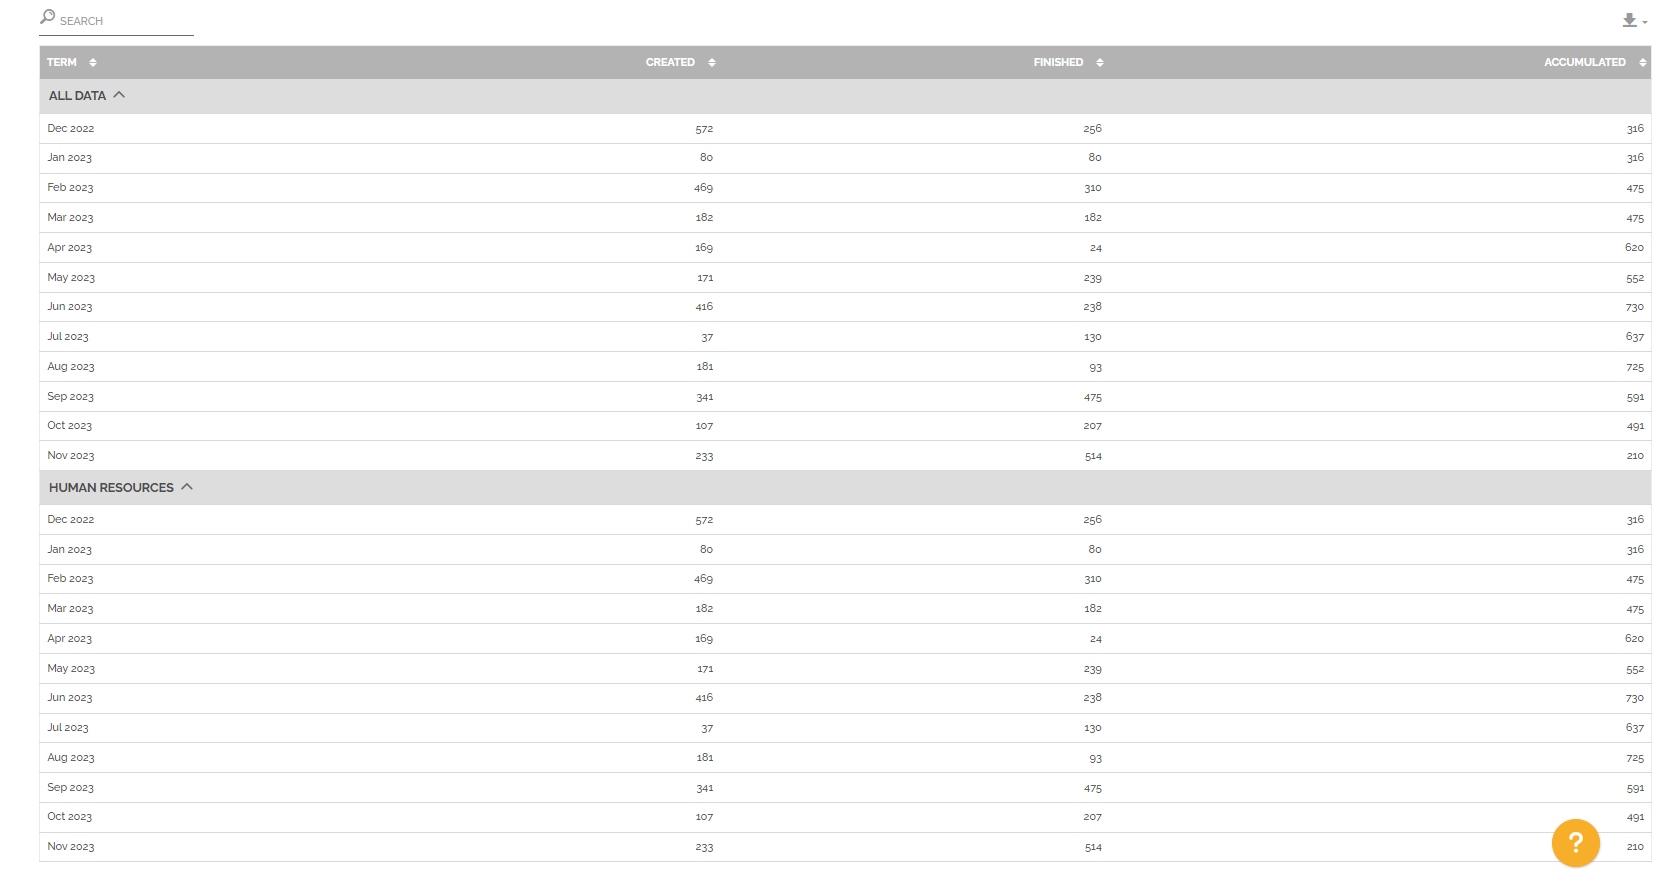
As with graphs, the analytical purpose of tables is different for each report.
In addition, the tables also adapt to the number of segmentations selected.
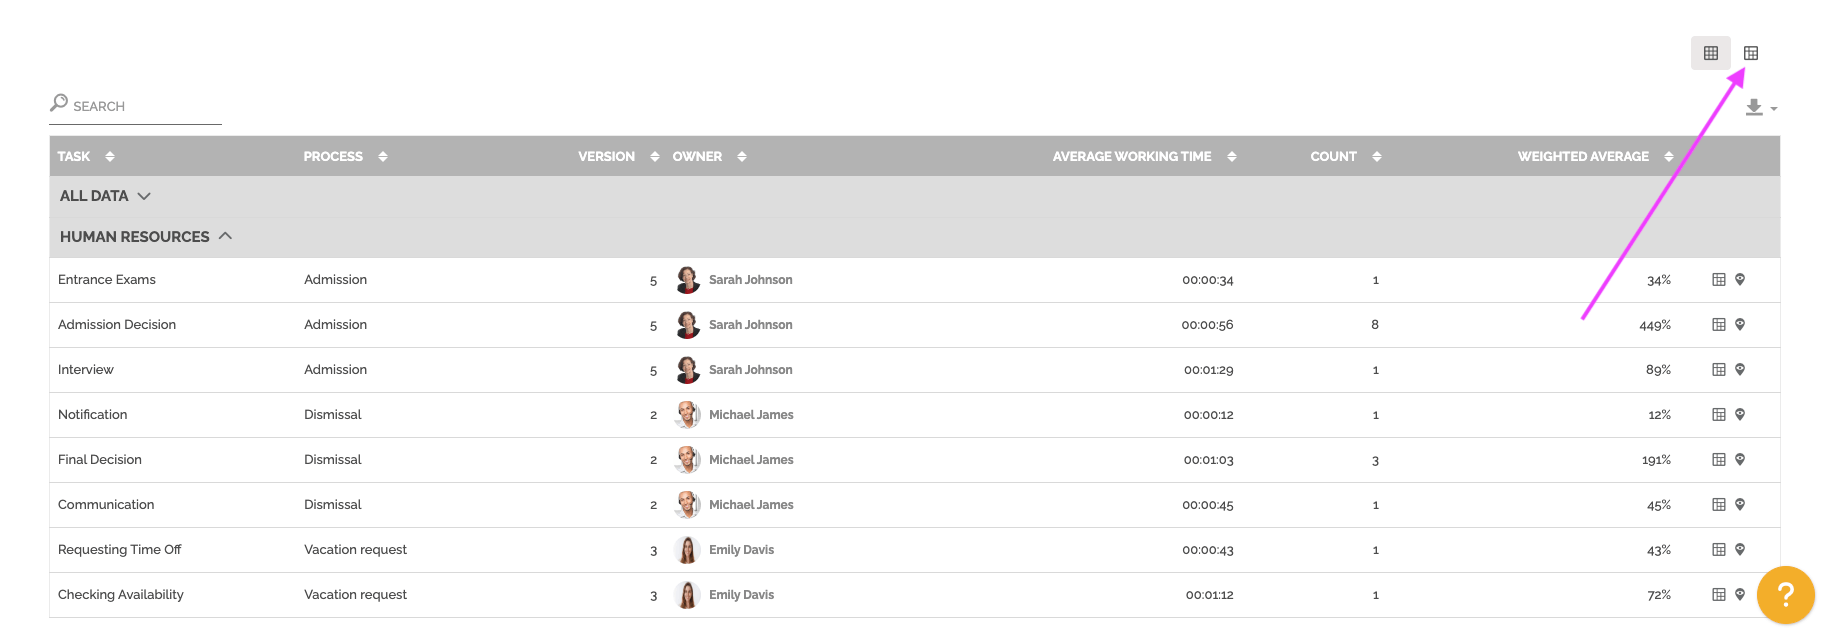
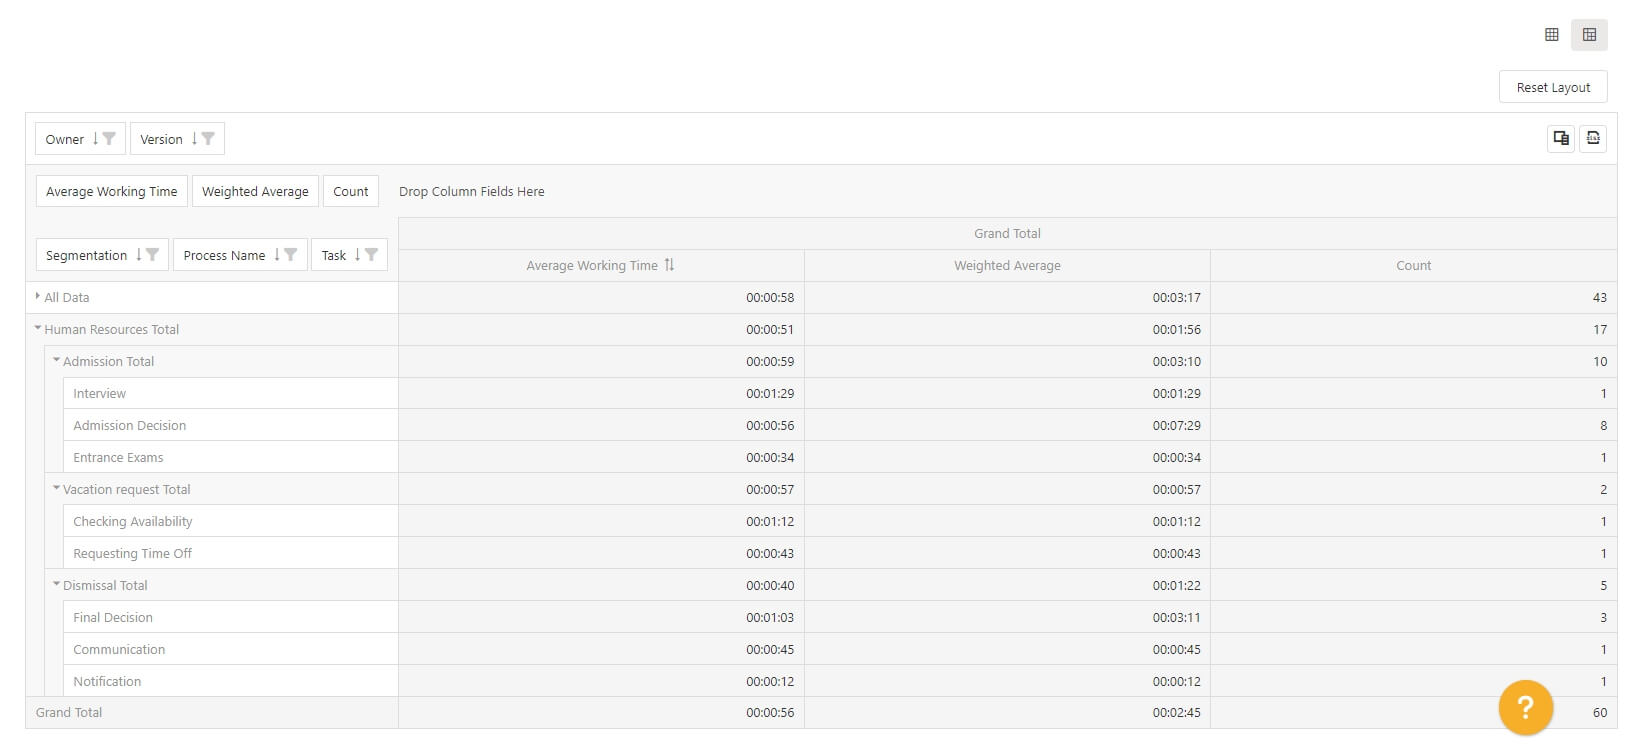
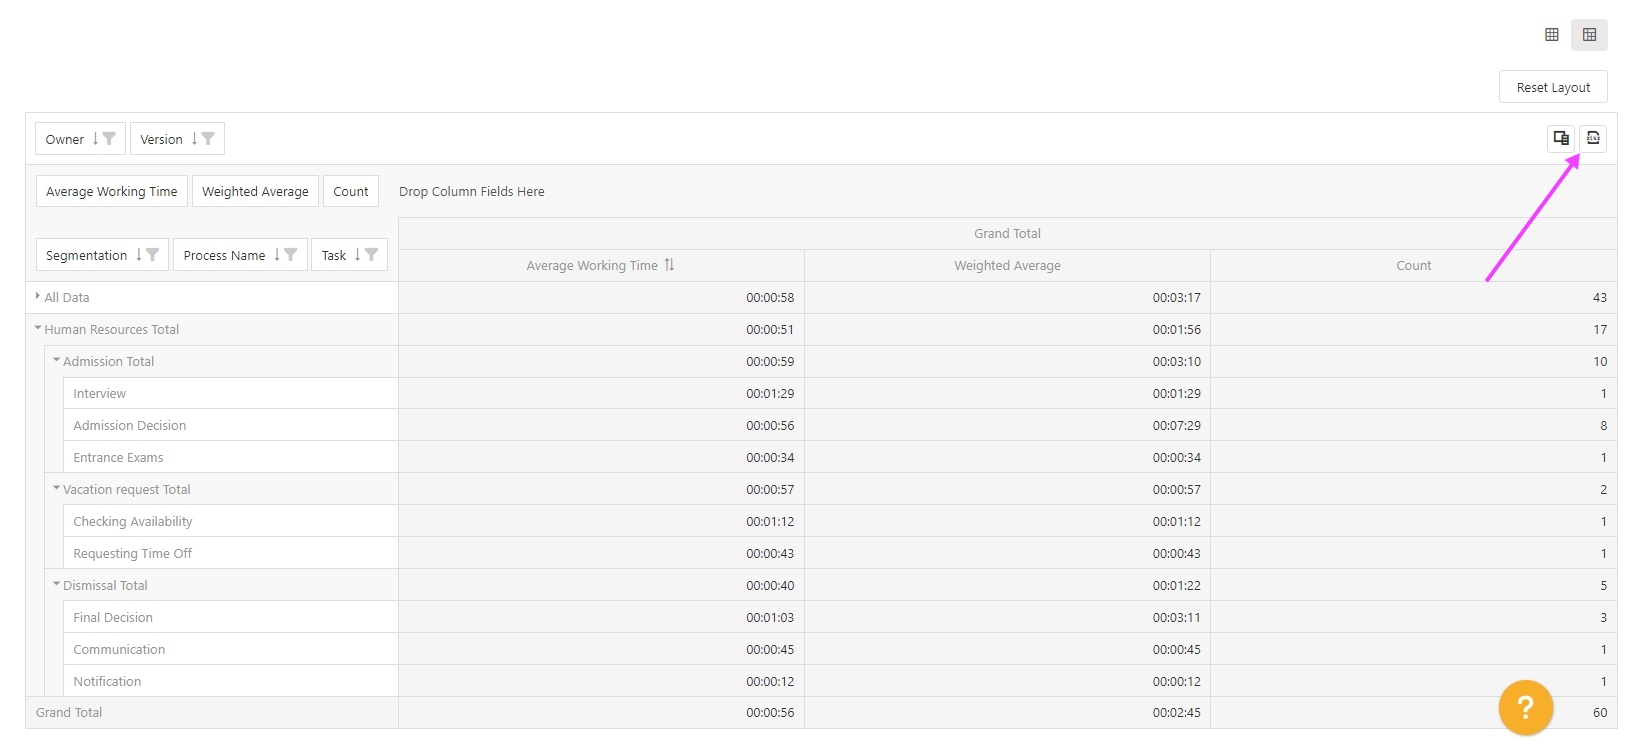
Pivot table
Some reports give you the ability to manipulate the data to create pivot tables to your analysis needs. These pivot tables are accessible by clicking on this icon ![]() .
.
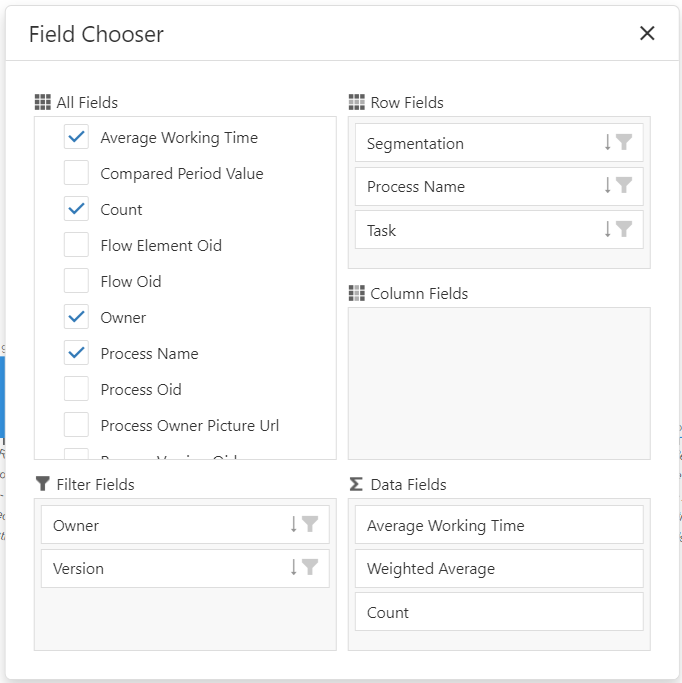
As for a classic pivot table, you can modify the indicators of the columns and rows to adapt the data studied:
You can have more details on the selected fields by clicking on this option:
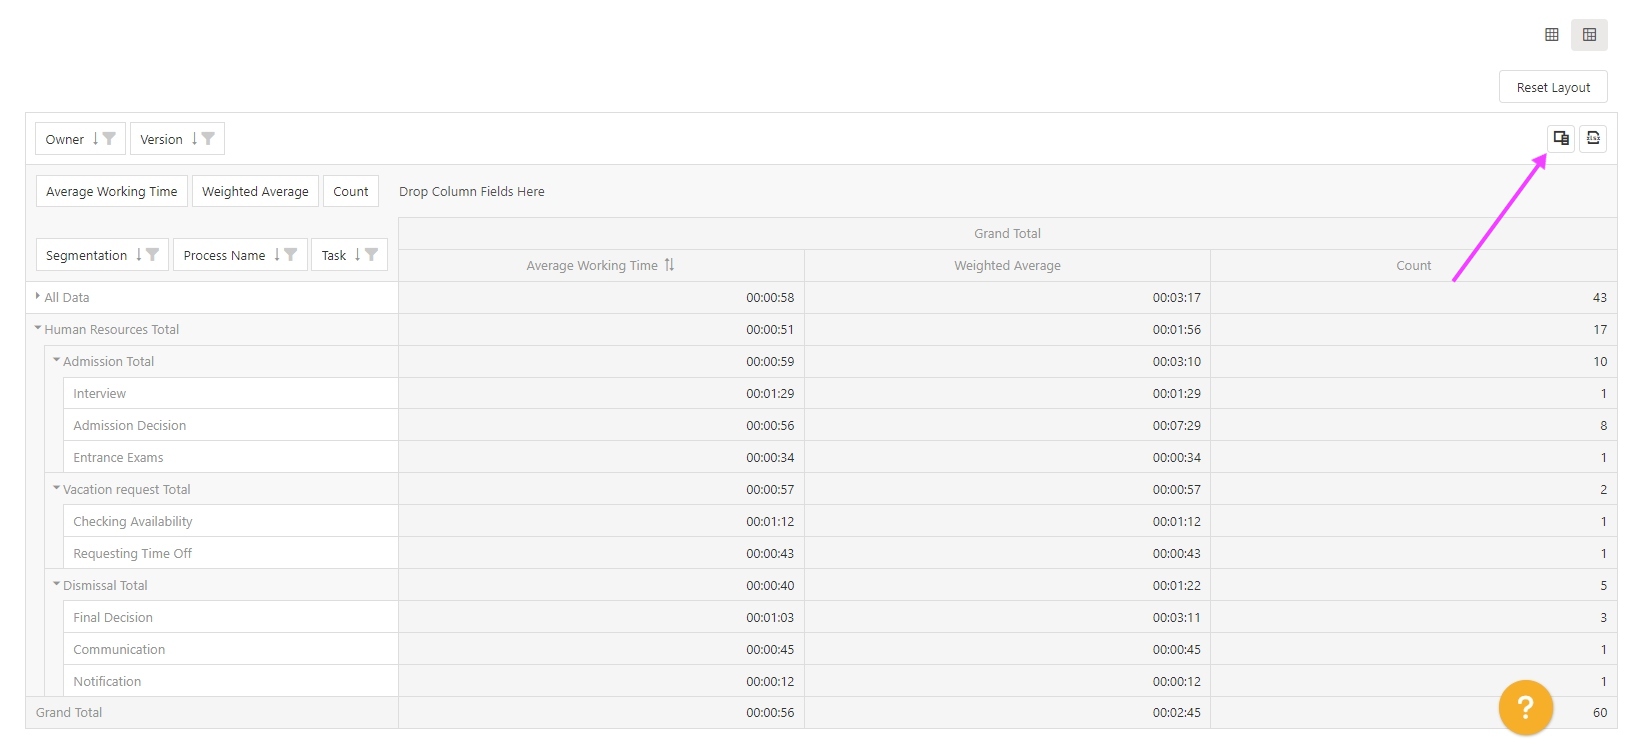
You can export your table in Excel format by clicking on this option:
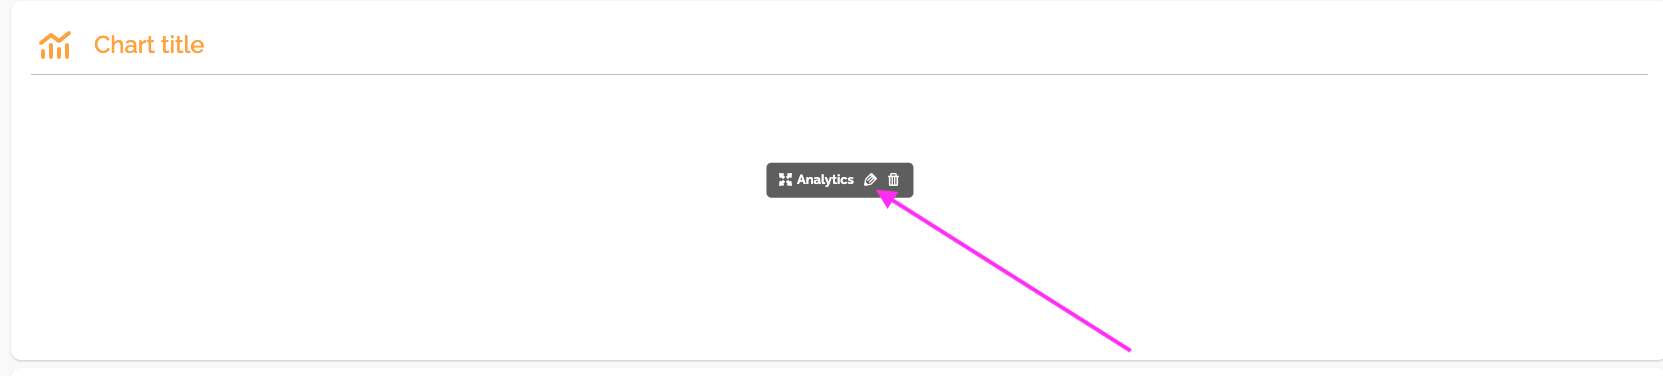
Embed an analytics report on a dashboard page
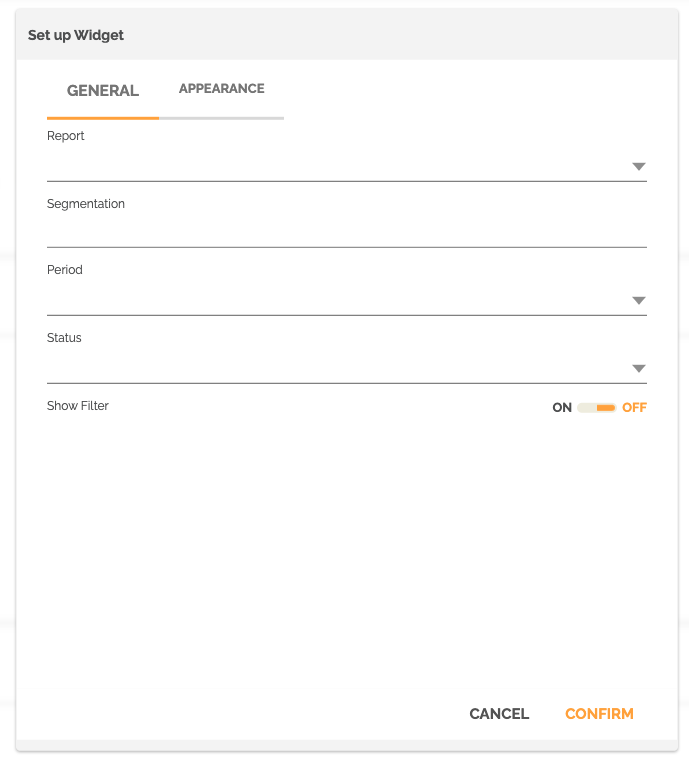
It is possible to add a widget containing one of the analytical reports.
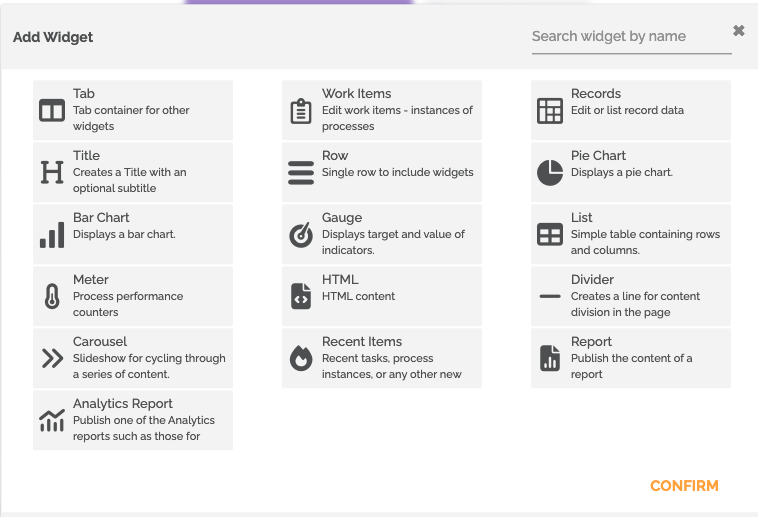
You must then edit it to choose the report, define its segmentation and the period studied.
To learn more about how to create dashboard pages and widgets: Tutorial: How to create a management dashboard.
You can check out the recording of our webinar on analytics reports: Webinar: Analytics reports.